
An Upgraded Model?: Testing the RSI vs the RSX
Evaluating the claim "new and improved"

We have lived in a “technical indicator zoo” for a long time now. You can find hundreds if not thousands of indicators across the web. But some indicators have stood the test of time because of their utility and simplicity. The Relative Strength Index (RSI) is one of these. The RSI has been around since 1978 and is available in practically every trading software.
Why fix what isn’t broken?
The ubiquity of the RSI made me truly disbelieve Jurik Research’s Relative Strength Quality Index. It felt like I was seeing someone tell me that Coca-Cola Spiced is better than Coke Classic (it’s not - don’t even DM me).
So, of course, I wanted to test it. In this post, we’ll construct 16 different RSI and RSX strategies and use the R2T Backtest Methodology to evaluate them on SPY.

Recap: RSI and RSX
The Relative Strength Index (RSI) is a momentum oscillator widely used in trading strategies to gauge the speed and change of price movements of an asset. The RSI is simple to understand because it ranges between 0 to 100. For interpretation, the RSI is typically used to identify overbought or oversold conditions in the market. A higher RSI indicates more frequent upward price moves, which might indicate more buying pressure. A really high RSI might indicate that an asset is “too hot” and that its price might correct or revert to the mean. (And the opposite applies for lower RSI values)
An asset is generally considered overbought when the RSI is above 70 and oversold when it is below 30. Meaning, an upward trend is seen as likely to reverse if the RSI is above 70, and a downward trend might be ready to reverse if the RSI is below 30.
The Relative Strength Quality Index (RSX) is a variation of the traditional RSI, designed to eliminate the choppiness associated with the RSI by applying smoothing techniques, making it more responsive to recent price changes without adding lag. The RSX maintains the same scale as the RSI, ranging from 0 to 100, and is used to identify overbought and oversold conditions in the same manner.
The primary difference between the RSI and RSX lies in their sensitivity and smoothness. While both aim to measure the momentum and identify overbought or oversold conditions, the RSX is designed to produce a smoother line that reacts more efficiently to recent price changes. This reduces the false signals that traders might encounter with the traditional RSI.
Despite its smoothing, the RSX manages to maintain a low level of lag, making it potentially more useful for traders looking for timely signals. The traditional RSI, while effective, can sometimes offer signals that are either too late or too sensitive to short-term price movements, leading to premature entries or exits.
The RSX's smoothed calculation makes it more suited for volatile markets, where the RSI's signals might be too erratic. Traders operating in these conditions might prefer the RSX for its ability to filter out noise and offer clearer signals.
We can see this visually in the below visualization of the RSI and RSX for SPY:

There are multiple points where the RSI bounces around thresholds, possibly giving multiple conflicting signals. The smoother RSX does not have such a problem. In addition, the lag in the RSX is not significant in this sample at all. That is a great feat for a smoothed indicator.
But does it give a better trading strategy? Let’s find out.
Trading Rules and Backtest Results
We start with a standard reversal strategy involving three parameters:
Window length
Lower Threshold
Upper Threshold
With the following trading rules:
Go long when the RSI or RSX crosses the lower threshold from below
Go short when the RSI or RSX crossed the uper threshhold from above
Our optimizations tested this parameter space:
Window: [2, 4, 6, … 50]
Lower threshold: [10, 12, 14, … 40]
Upper threshold: [60, 62, 64, … 90]
Total parameter combinations: 6400
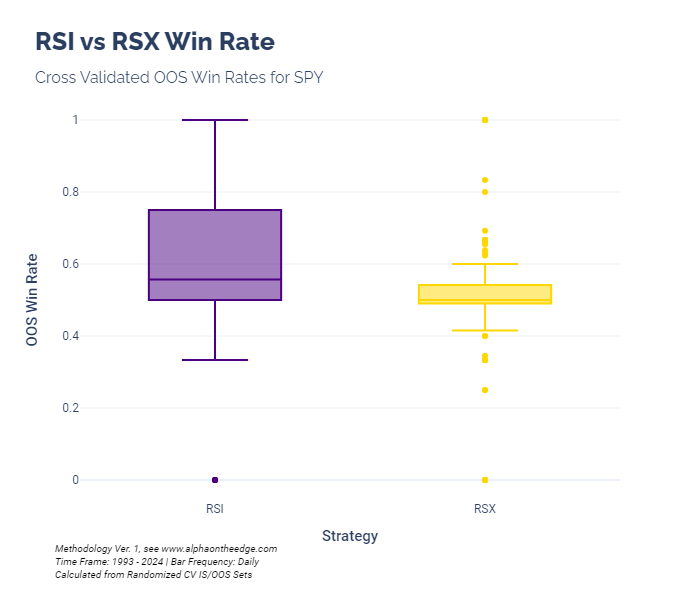
The RSX version of this strategy was far more consistent in terms of win rate but not as rewarding:
And the correlation between OOS win rate and OOS expectancy was also slightly lower:

If we look at IS/OOS accuracy for Sharpe ratios, there’s also a slight advantage for the original RSI:

Variations: Using Risk Management
It’s worth taking these somewhat basic strategies and looking at variations with stop losses, trailing stops, and trailing take profits. This tests the idea that these strategies might be asymmetrically flagging good or bad events. Meaning, one trade that gets unlucky could wipe out your capital. Good risk management will mitigate that asymmetry.
In addition, we also look at taking less capital risk by use only long orders instead of using long and short orders, as above.
In total, we test 8 different variations of the RSI and RSX strategies, totaling 16 variations:
Long only
Long only with 10% stop loss
Long only with 10% trailing stop
Long only with 10% trailing stop and 15% trailing take profit
Long and short
Long and short with 10% stop loss
Long and short with 10% trailing stop
Long and short with 10% trailing stop and 15% trailing take profit
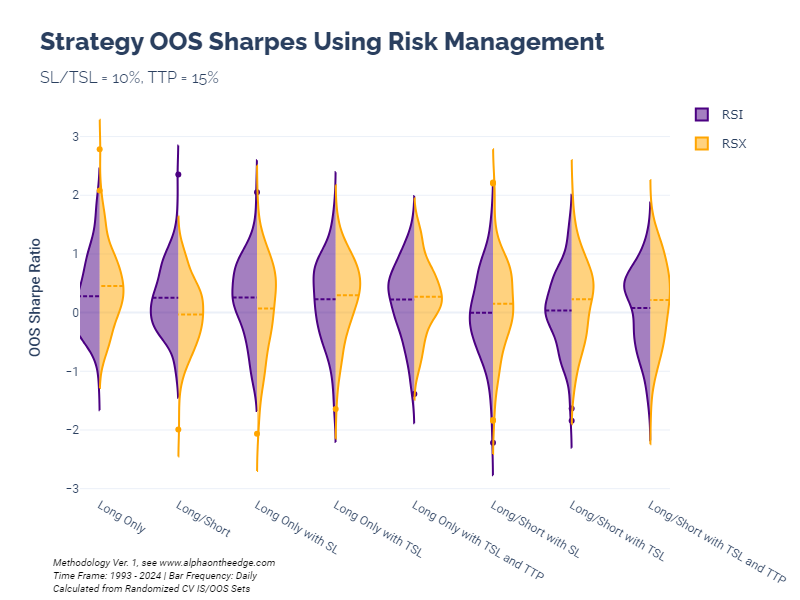
A few interesting observations from this:
Both strategies tend to achieve higher Sharpe ratios when long only no matter the use of risk management
The RSX strategy has higher median OOS Sharpe ratios than the RSI strategy in 6 of the 8 variations tested
The highest Sharpe ratios come from the long only strategy without risk management, with the long only RSX strategy achieving the highest median OOS Sharpe ratio among all variations tested
The long/short strategy saw the highest discrepancy between RSI and RSX with the RSX achieving worse results, which might explain the shortfalls seen in win rates, expectancy, and IS/OOS Sharpe ratios
Conclusions
The RSX is undoubtedly a less volatile and less sensitive version of the RSI, which can reduce the noise produced by RSI threshold crossovers.
When looking at unbounded long/short strategies, however, the RSI tends to provide more favorable results, indicating that bets on the RSX’s upper threshold benefit from risk management. Indeed, in all of the variations of the long/short strategy tested with risk management tools, the RSX strategy outperformed on a risk-adjusted basis.
Overall, the evidence here supports consideration of the RSX in trading strategies. The superior risk-adjusted performance on most tests indicates that the indicator gives a more reliable signal, not just a smoother ride.
Until next time, keep on the cutting edge, everyone.
Resources
The R2T Backtesting Framework, Ver. 1
Disclaimers
The content on this page is for educational and informational purposes only. Any views and opinions expressed belong only to the writer and do not represent views and opinions of people, institutions, or organizations that the writer may or may not be associated with.
No material in this page should be construed as buy/sell recommendations, investment advice, determinations of suitability, or solicitations. Securities investment and trading involve risks, and not all risks are disclosed or discussed here. Loss of principal is possible. You are encouraged to seek financial advice from a licensed professional prior to making transaction decisions.
Further, you should not assume that the future performance of any specific investment or investment strategy will be profitable or equal to corresponding past performance levels. Past performance does not guarantee future results.