
Does exponential weighting actually give better results?
Evidence from backtesting crossover strategies on FX majors

When many of us were very young, we sometimes let intellectual curiosity get the better of us. We just wanted to ask “But why?” again and again. We didn’t know it was intellectual curiosity at the time; we just wanted to bug our parents to get answers.
I was one of those kids who went overboard. I was especially insistent when I was being told to do something more complicated for reasons I didn’t understand. I rebelled against hand-wavy answers like “It’s good for you!”
Such is the case with more complicated moving averages. I like the simple moving average because it’s, well, simple. Why improve on such a simple concept?
These days, instead of asking too many questions, I can actually research the reason myself - with millions of backtests.
In this post, we will briefly go over the moving average crossover strategy and two types of moving averages - the exponential moving average (EMA) and the simple moving average (SMA). Then, we will look at empirical evidence about the benefits of using the EMA instead of the SMA.
Quick Review - Moving Averages and the MA Crossover Strategy
A moving average smooths out price data over a specified time frame, providing a visual representation of the average price over that period. It helps traders and analysts identify the direction of the trend and potential support and resistance levels.
Simple Moving Average (SMA): The SMA is calculated by taking the arithmetic mean of a set of prices over a specific number of periods. For example, a 20-day SMA would sum up the closing prices of the last 20 days and divide the total by 20. The SMA treats all prices equally, regardless of their recency, which can sometimes result in a delay in detecting price trends.
Exponential Moving Average (EMA): The EMA provides a more weighted approach to moving average calculations, giving more significance to recent prices. This is achieved through a formula that applies a multiplier to more recent price data. The EMA's sensitivity to recent price movements allows it to react more quickly to price changes than the SMA, potentially offering earlier signals for traders.
The MA Crossover strategy involves plotting two moving averages of different lengths on a price chart. The shorter moving average is faster because it considers fewer data points, thus reacting more quickly to price changes. The longer moving average is slower, providing a more lagged view of the price trend because it includes more data points.
Buy Signal: A buy signal is generated when the shorter (faster) moving average crosses above the longer (slower) moving average. This crossover indicates that a potential upward trend is starting, suggesting that it might be a good time to enter a long position.
Sell Signal: Conversely, a sell signal occurs when the shorter moving average crosses below the longer moving average. This suggests that a downward trend is beginning, potentially signaling a good time to sell or short the asset.
Let’s look at this visually with the SPDR S&P 500 ETF Trust (SPY). First, we plot SPY’s close against a fast SMA and a slow SMA and the accompanying buy/sell signals.
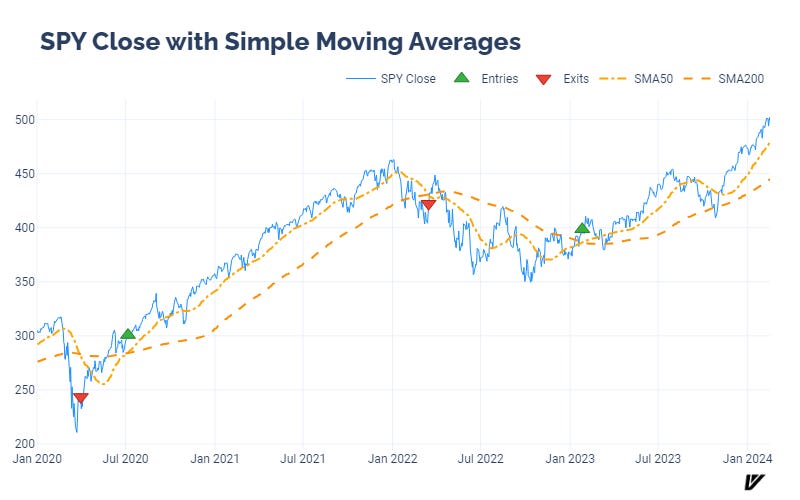
The MA crossover in July 2020 occurred when the 50-day SMA crossed the 200-day SMA from below. This caught the beginning of the long post-COVID bull market. The subsequent sell signal in early 2022 missed a little bit of the early downtrend, but it still locked in a good amount of profits.
Let’s look at the same chart with the EMA instead of the SMA:
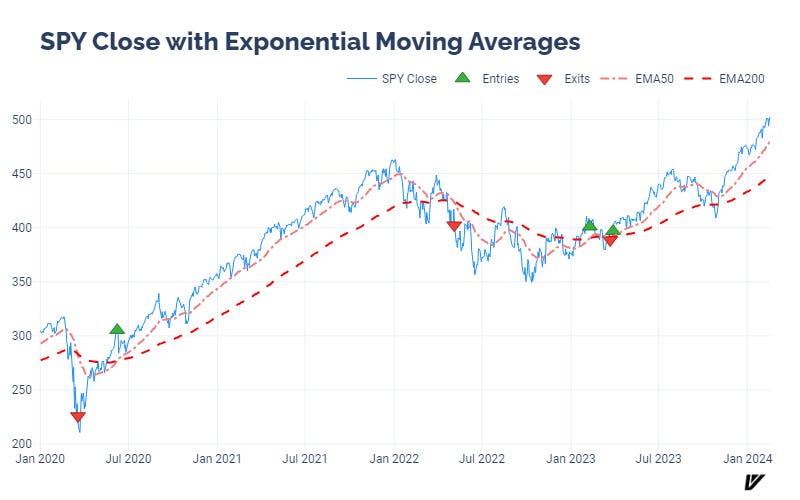
We see similar signals, however, the signals tend to occur more frequently owing to the more rapid change in EMA during a flat market.
Say we went long at a buy signal, then short at a sell signal. How well would such a strategy perform?

Not well, and the EMA strategy performs much worse because it mis-labelled trends in the mid-2000s.
SMA vs EMA Trading Strategies on FX Major Pairs
So, does the choice really matter? We can answer this with our really, really thorough backtesting methodology.
(Highly recommend checking out this methodology overview if needed)
We have used randomized cross-validation sets to optimize and test the two strategies on 28 FX pairs. This uses over 15 million tests and simulations!
Finally, an in-depth answer to my favorite question, “But why?”
Here are the median strategy metrics:
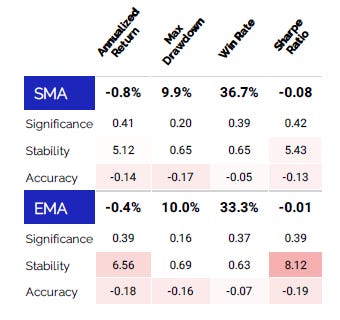
It turns out that not only are both strategies ways to lose money, but the EMA crossover does tend to perform slightly better both on an absolute and risk-adjusted basis.
Still, even if you are losing money a little more slowly, you are still losing money.
It is interesting that the EMA crossover has a wider dispersion of OOS Sharpe ratios over the random CV sets:
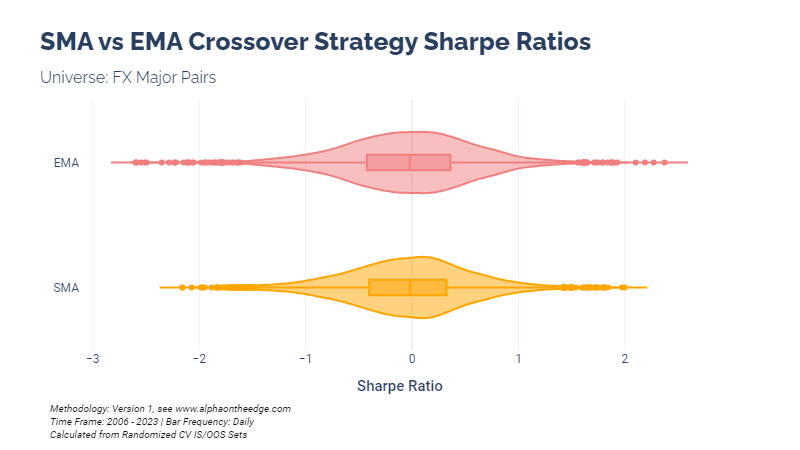
Additionally, the difference is not the same among the different FX pairs. Although all pairs show similarly ignorable Sharpe ratios with both strategies, the EMA does not change strategy Sharpe ratios in the same way:

Using an EMA Crossover instead of an SMA Crossover does make a difference, although negligible. Neither strategy is a winner, either way.
In the future, we can look using different MA types as confirmation signals layered on top of other strategies.
And there are more than a handful of other MA flavors floating around, which we might look into, as well….
Until next time, keep on the cutting edge, everyone.
Disclaimers
The content on this page is for educational and informational purposes only. Any views and opinions expressed belong only to the writer and do not represent views and opinions of people, institutions, or organizations that the writer may or may not be associated with.
No material in this page should be construed as buy/sell recommendations, investment advice, determinations of suitability, or solicitations. Securities investment and trading involve risks, and not all risks are disclosed or discussed here. Loss of principal is possible. You are encouraged to seek financial advice from a licensed professional prior to making transaction decisions.
Further, you should not assume that the future performance of any specific investment or investment strategy will be profitable or equal to corresponding past performance levels. Past performance does not guarantee future results.
As always very cool analysis 😎 It would be interesting to see what happens if you reverse the strategy. Instead of buying/selling on a crossover you would do the opposite and sell/buy. This should be a quick check if you still have the notebook. I suspect that the result is still not a winning strategy? And here comes our favorite question, that I feel like I would learn something important from for designing strategies, but why not? :)