
Introduction to Market Drivers
The factors that move the markets

I have a small dog at home, a chihuahua mix I adopted a few years ago. When you have a pet for this long, you get a good sense of what’s motivating their behavior. (And they learn about you, too!) If my dog is trying to wake me up in the morning, he probably needs to go outside. That’s pretty simple. If he stops playtime earlier than normal, that can be a little harder to figure out. Sometimes he’s stressed by something happening outside; other times, it could be something causing him pain. (We have a vet visit next week to figure that one out, as it happens.)
If only it were this easy to identify cause and effect in capital markets.
The drivers (or factors) behind market returns are the subject of libraries of research. It is a fascinating area of study, and in this post, we will discuss a useful type of research that uses rules-based portfolios to analyze those drivers. By keeping an eye on these drivers, traders can make smarter choices and diversify their portfolios easily.

Forming Factor Portfolios
First, we have to choose our investment universe. Often, researchers will choose stock indexes, so for fun, we will go against the grain and look at the top 50 cryptocurrencies by market cap. We exclude stablecoins and coins with less than two years of trading history.
Second, we choose a factor to analyze. This analysis begins with the trailing 30-day volatility, measured by the standard deviation of daily returns.
Third, we use a straightforward ranking methodology to form portfolios. Our algorithm will measure the 30-day volatility of each of the 50 cryptocurrencies, rank them, and separate them into quintiles. We then go long the top quintile (buy the 10 CCs with the highest 30-day volatility) or really concentrate our factor exposure and go long the top quintile and short the bottom quintile.
Say we re-measure 30 day volatility each week and buy the 10 coins in each quintile with equal weighting. Here’s how the portfolios would have performed:
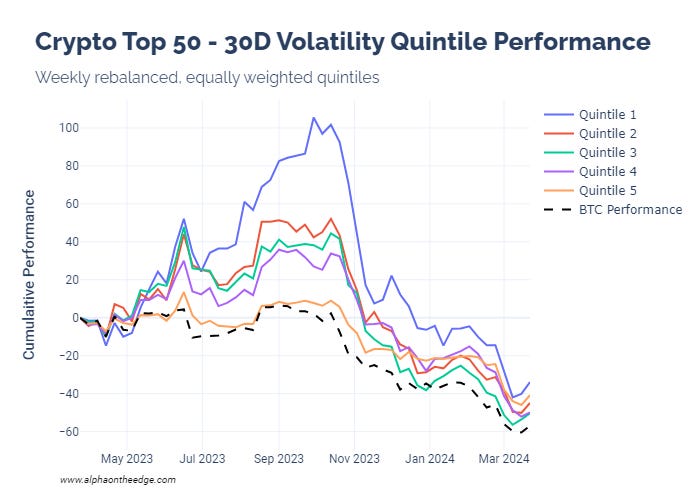
For half of the 1 year period, the quintile 1 portfolio outperformed the quintile 2 portfolio, the quintile 2 portfolio outperformed the quintile 3 portfolio, and so on. This is what makes market driver research so fascinating - even a simple ranking methodology can create superior portfolios.
And what’s more, every single portfolio outperformed Bitcoin over the period. Even the lowest volatility portfolio achieved superior performance.
We often see this stratification on a risk-adjusted basis, too:
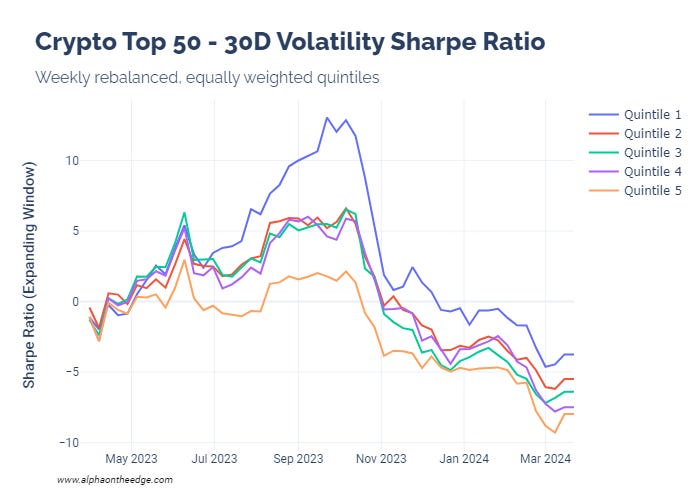
So does this mean that volatility explains price action in crypto markets? Not quite, but it does mean that volatility is a factor that might drive performance. Our job is to observe the strength of that driver and measure it against other possible market drivers.
Measuring Market Drivers
Let’s introduce two more factors into our analysis:
Ratio to 52W High - The ratio of the last close to the previous 52 week high. This assumes mean-reverting behavior in prices.
Momentum 1W4W - The ratio of the 1 week return to the 4 week return. A higher ratio above 1 suggests an accelerating price increase, meaning that the price could have positive momentum.
The traditional performance measure of a driver/factor is the long-short performance - long the top quintile, short the bottom quintile, and rebalance after every period (weekly in our case). This measures the performance of a portfolio concentrated to capture that driver’s effects.
Here is the long/short performance of the three factors over 1 year:
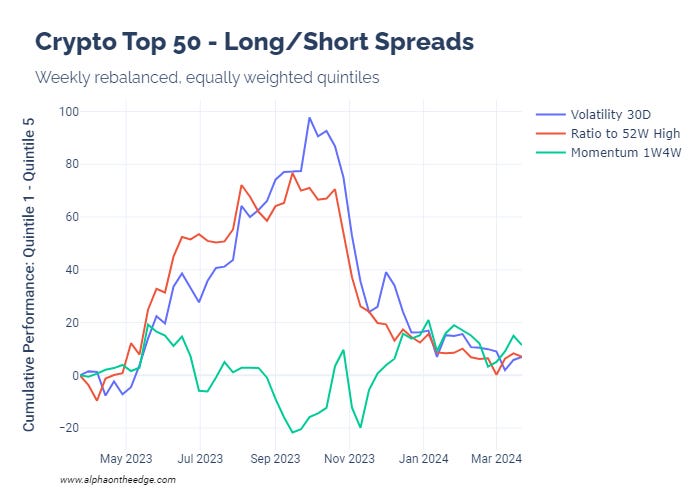
Our volatility and mean-reversion factors show very similar performance, while the momentum factor was mostly flat over the period.
This illustrates another use for this methodology: diversification. While the volatility and mean reversion portfolios are highly correlated, the momentum portfolio is less correlated to both. And it turns out that all three portfolios have low (less than 0.3) correlation to Bitcoin, as well. This means that traders might be able to mitigate risk through this methodology, as well.
There is one more useful metric of driver strength - the correlation of the factor value with the subsequent security returns. (This is also called the information coefficient.) This is another way to measure how strong the relationship of the factor to performance might be. In practice, a correlation above 0.02 or below -0.02 is often considered significant.
Summarizing the measurements of the three factors here:
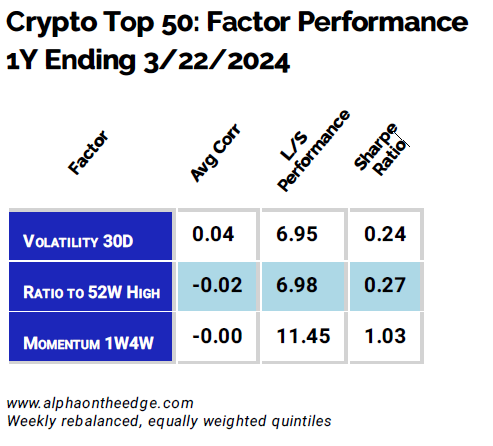
“Avg Corr” means that we measure the correlation of factor values to forward 1 week returns each period, then average the measurement for all periods.
A few things stand out here. Momentum outperformed on an absolute and risk-adjusted basis, but the low correlation with returns suggests that the relationship might be spurious. That portfolio could have just been lucky, in other words.
Additionally, our original volatility factor has the correlation with the highest absolute value, suggesting that it has the strongest relationship to returns among the three factors. This doesn’t mean that we should all go invest in volatile coins. Rather, it means that this is a factor that we could watch through time and, if the strength of the relationship holds, look at more deeply.
I hope this helps give a better understanding of why we like talking about market drivers around here. Expect to see more material on this soon.
(And it’s a good time for me to sign off, dinner time is clearly a factor driving my dog’s behavior right now!)
Until next time, keep on the cutting edge, everyone.
Disclaimers
The content on this page is for educational and informational purposes only. Any views and opinions expressed belong only to the writer and do not represent views and opinions of people, institutions, or organizations that the writer may or may not be associated with.
No material in this page should be construed as buy/sell recommendations, investment advice, determinations of suitability, or solicitations. Securities investment and trading involve risks, and not all risks are disclosed or discussed here. Loss of principal is possible. You are encouraged to seek financial advice from a licensed professional prior to making transaction decisions.
Further, you should not assume that the future performance of any specific investment or investment strategy will be profitable or equal to corresponding past performance levels. Past performance does not guarantee future results.