
Strategy Evaluation, Part 1 - In-Sample and Out-of-Sample Testing
Why one backtest is not enough

Welcome to the first post in our series outlining our approach to strategy evaluation. Many concepts will be familiar to seasoned traders, but new entrants might enjoy the introductions here. The goal with this series is to build a shared vocabulary for us and our readers to use as we ask if a strategy is actually worth our time and capital.
We start with an old friend - the SPDR Gold Trust (GLD) ETF - and an even older friend - the MA crossover trading strategy. The MA crossover strategy is easy to grasp and makes for an easy conversation around backtesting.

As a quick review - the MA crossover strategy involves two moving averages of a security's price—a "fast" one that considers fewer periods, and a "slow" one that accounts for more periods. The strategy signals a buy when the fast MA crosses above the slow MA, and a sell when it crosses below. A strategy definition thus involves two parameters: a fast period, and a slow period.
The Temptation of Backtesting and Its Pitfalls
I could easily take GLD's price history, crunch numbers, and find the optimal parameters for this strategy. I could even take a snippet of GLD’s history, find the perfect parameters for that period, and flaunt the stellar performance from the backtest.
I can see the YouTube title card now - surprised face with gold sparkles and the text "I've conquered gold!"
This is incomplete at best and at worst, it verges on fraud.
The reality is, when a strategy is implemented in the live market, it rarely mimics historical performance. This divergence from history to reality is a truth many traders learn the hard way. Experienced folks are likely nursing battle scars from trades past.
Finding the perfect strategy for a specific historical period is known as curve fitting. It's essentially tailoring your strategy so closely to historical data that it becomes useless in predicting future market behaviors.
Much smarter researchers call this a "lack of generalizability." I tend to think of it a different way - it's dangerous. It can put your capital at high risk.
In-Sample and Out-of-Sample Splits
One way to mitigate this is through In-Sample (IS) and Out-of-Sample (OOS) splits. We optimize the strategy parameters on the IS period and test its performance on the OOS period. The below visualizes GLD's price history split into 75% IS and 25% OOS:

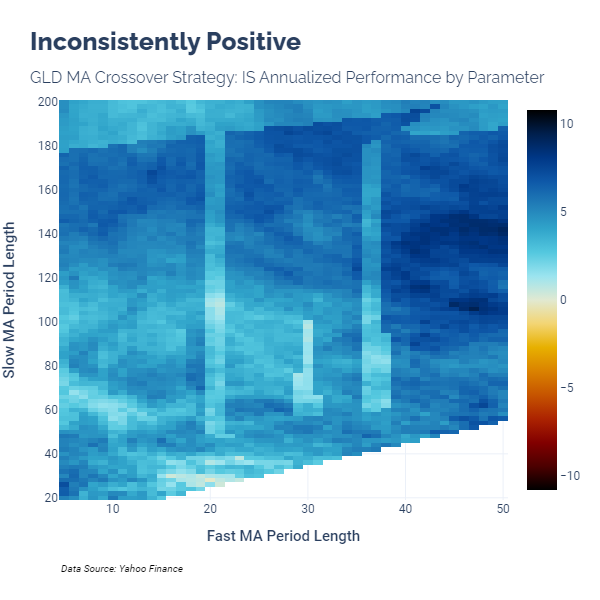
Imagine running thousands of parameter combinations for the MA Crossover on GLD, then visualizing the annualized returns for each combination in a heatmap. For our in-sample period, we find that the best combination is a 47-bar fast period and a 106-bar slow period, yielding a respectable 9% annualized return.
However, when we look at the same parameter combinations in the OOS sample, we see a different story. Adjacent parameter combinations show drastically different results, hinting at data quirks and the precarious nature of our choices. One trade could significantly skew the results, raising red flags about the strategy's reliability.
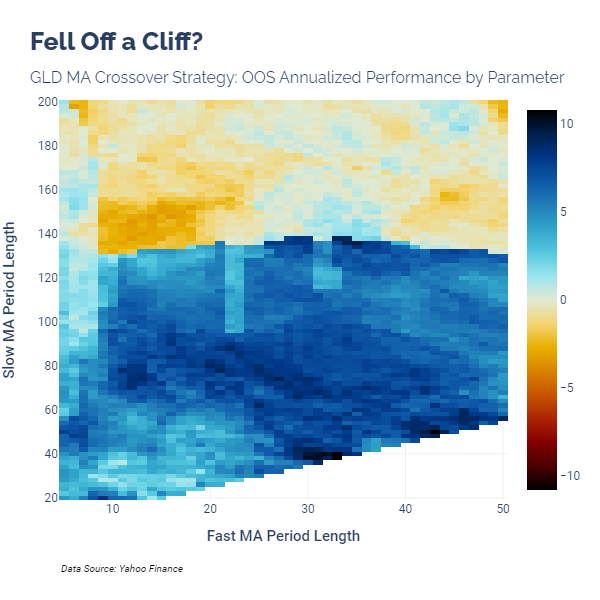
This brings us to a critical point—relying on a single backtest, even with IS/OOS splits, is not sufficient. A scatter plot pairing the annualized returns from the IS and OOS periods visually underscores this inconsistency.

So, obviously, we don’t want to trust in-sample performance to persist into an out-of-sample period in this case.
What if we alter the OOS percentage? Our next visual explores just that. It shows the distribution of IS and OOS strategy performances across varying OOS percentages.

Interestingly, except for a 30% split, disparities abound in each percentage. But how would we, blindly looking for a single backtest, know to choose a 30% split beforehand? The answer is: you wouldn't unless you were curve fitting even on an OOS data set.
So, how do we address this challenge? We will discuss more in the next posts in this series.
Until next time, keep on the cutting edge, everyone.
Disclaimers
The content on this page is for educational and informational purposes only. Any views and opinions expressed belong only to the writer and do not represent views and opinions of people, institutions, or organizations that the writer may or may not be associated with.
No material in this page should be construed as buy/sell recommendations, investment advice, determinations of suitability, or solicitations. Securities investment and trading involve risks, and not all risks are disclosed or discussed here. Loss of principal is possible. You are encouraged to seek financial advice from a licensed professional prior to making transaction decisions.
Further, you should not assume that the future performance of any specific investment or investment strategy will be profitable or equal to corresponding past performance levels. Past performance does not guarantee future results.