
Strategy Evaluation, Part 2 - Cross Validation
Adapting the machine learning standby to trading strategies

Welcome back to our series on strategy evaluation in trading. This post, while a review for some, is crucial for developing a shared vocabulary and understanding of complex backtesting methods. We will start getting into backtesting at scale, which can introduce key methodology issues. It can also introduce invaluable insights, so let’s get into it.
Quick Recap and Introduction to Cross Validation
In our last post, we looked at in-sample (IS) and out-of-sample (OOS) backtesting. As a brief recap, this method splits the data into two segments: one for developing the strategy (IS) and the other for testing it (OOS). However, we concluded with an intriguing observation: even slight alterations in the OOS percentage could dramatically shift backtest results.
Let's return to our ETF of choice, GLD - the SPDR Gold Trust.

In the realm of machine learning, cross-validation is a staple technique. It involves partitioning a dataset into complementary subsets, performing the analysis on one subset, and validating the analysis on the other subset. Its utility lies in its ability to mitigate overfitting or curve fitting, providing a more accurate measure of a model's performance.
Applying Cross-Validation to Backtesting
Cross-validation can also be applied to time series and backtesting. A prevalent method here is walk-forward optimization (WFO). In WFO, we divide a dataset into several time periods. Each period is further split into IS and OOS segments, say 80% for IS and 20% for OOS. We optimize the strategy on the IS part and then test it on the OOS part.
Imagine breaking up GLD's historical data into 30 periods, each with an 80% IS and 20% OOS split. The splits would look like this:

After running this, we'd have a simulated portfolio where the strategy remains constant, but the underlying parameters vary with each period. For instance, using the MA crossover strategy, we might start with a 45-bar fast period and a 100-bar slow period for the first OOS period, then reoptimize for the subsequent one.
WFO is not flawless. Constant reoptimization resembles a form of curve fitting. However, it's significantly more robust than a single IS/OOS split, primarily because of its iterative nature and adaptability to new data.
But WFO isn't the only cross-validation technique for time series. The key lies in identifying the specific question your backtest seeks to answer. For us, the primary question is, "How robust is this strategy?" This inquiry is parameter-agnostic; we're interested in the viability of the MA crossover strategy itself, regardless of the specific parameters.
Randomized Splits: A Different Approach
Another intriguing method is randomized splits. Here, we randomize both the overall split length and the percentage of each OOS split.
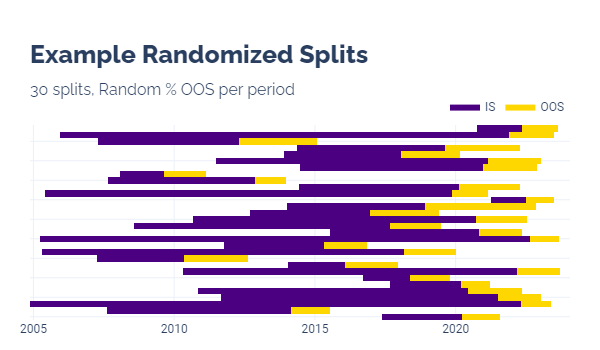
This approach, while useful, introduces 'leakage,' where one period may overlap with others, unlike the sequential, non-overlapping nature of WFO.
Despite its pitfalls, randomized splits shine in assessing strategy robustness, helping us evaluate if a strategy holds up over various random periods. WFO, in contrast, is less effective in this regard because it uses fixed length, uniformly advancing periods
Both WFO and randomized splits are invaluable, allowing us to observe distributions of strategy performance.
The following visualization shows the distribution of OOS strategy performance using randomized splits. That is, for each split, we find the optimal parameter combination for the IS period and run that combination on the OOS split.

The Role of Probability in Strategy Assessment
Probability-based techniques are particularly useful for gauging strategy robustness. It says if we were to apply this strategy on a random period to optimize the parameters and begin trading GLD, our probability of success is akin to flipping a coin. This is not a significant edge, but the probabilistic nature of the evaluation adds nuance to our evaluation.
Looking Ahead
As we dive deeper into the world of strategy backtesting, it's clear that no single method is foolproof. Each technique, from WFO to randomized splits, offers unique insights and comes with its own set of limitations. Understanding these methods, and more importantly, knowing which questions they help answer, is key to developing robust trading strategies.
In our next post, we'll explore other probability-based tools and how they can enhance our understanding of strategy robustness. Stay tuned as we continue to peel back the layers of this complex yet fascinating world of trading strategy evaluation.
Until next time, keep on the cutting edge, everyone.
Disclaimers
The content on this page is for educational and informational purposes only. Any views and opinions expressed belong only to the writer and do not represent views and opinions of people, institutions, or organizations that the writer may or may not be associated with.
No material in this page should be construed as buy/sell recommendations, investment advice, determinations of suitability, or solicitations. Securities investment and trading involve risks, and not all risks are disclosed or discussed here. Loss of principal is possible. You are encouraged to seek financial advice from a licensed professional prior to making transaction decisions.
Further, you should not assume that the future performance of any specific investment or investment strategy will be profitable or equal to corresponding past performance levels. Past performance does not guarantee future results.