
Strategy Evaluation, Part 4 - Why Do We Need Millions of Backtests?
Raising the bar for data-driven decisions

In this series on strategy evaluation, we have discussed different ways of answering the question: “Is a trading strategy any good?”
Three techniques we have looked at:
Out-of-sample testing for combating curve-fitting by assessing how well a strategy performs on unknown data
Cross-validation to make our performance measurements more robust and reliable
Monte Carlo simulation to model uncertainty and risk and tell if a strategy’s results are pure luck
With these tools at our disposal, the process of measuring parameter combinations and running simulations can quickly escalate into millions of tests and simulations. You might be asking, "Why do we need all this? Why bother?”
The answer lies in high standards for what makes a "good" strategy. It's not enough to blindly trust a single backtest on a single security. In fact, we wouldn't even place our trust in a million backtests on a single security. Our criteria demand that a strategy's results are significant, stable, and accurate—across many securities.
We will discuss these by revisiting the MA crossover strategy used throughout this series. This time, we have backtested this strategy on 28 FX major pairs. For each FX pair, we created 200 random IS/OOS splits for cross-validation, tested 1940 parameter combinations, and ran 1000 Monte Carlo simulations for the optimal parameter set for each OOS period. That’s around 16 million tests and simulations.
Let’s discuss each criteria.
Significance
Significance is often measured through p-values calculated through Monte Carlo simulations. A p-value helps us determine the strength of our results by providing the probability that the observed results happened by chance. This is crucial because it helps us sift through the noise to find truly significant results. A low p-value indicates that the likelihood of the observed performance happening by chance is low, thereby bolstering our confidence in the strategy's effectiveness.
With the MA crossover strategy, we find that the p-values of the OOS Sharpe ratios are not consistent at all.
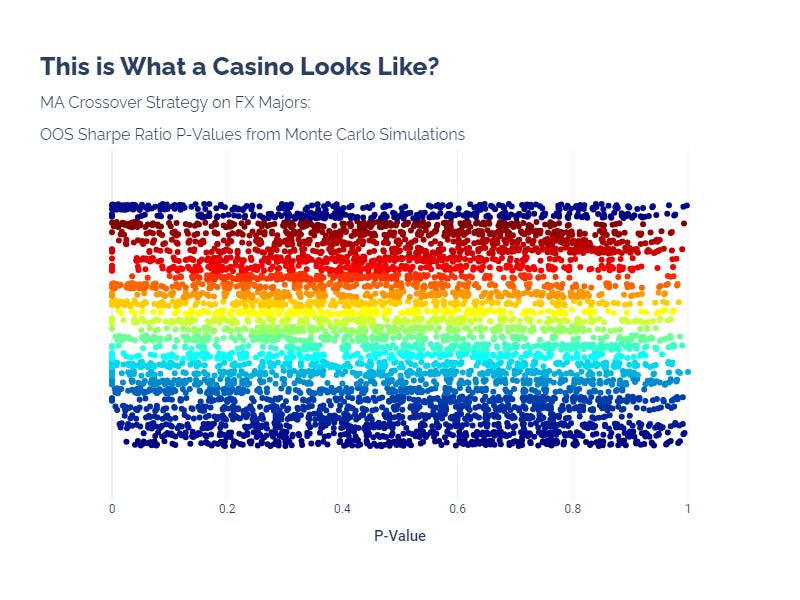
This tells us that we could get a highly significant result, but more importantly, we really have no idea how significant our result will be. This looks like a roulette spin. We might as well go to the casino.
Stability
Stability is about consistency in performance. Stability ensures that a strategy's performance isn't just a one-hit wonder but can be expected to deliver consistently over time. High variability in results could signal that the strategy performs well under very specific conditions only, making it unreliable under changing market dynamics.
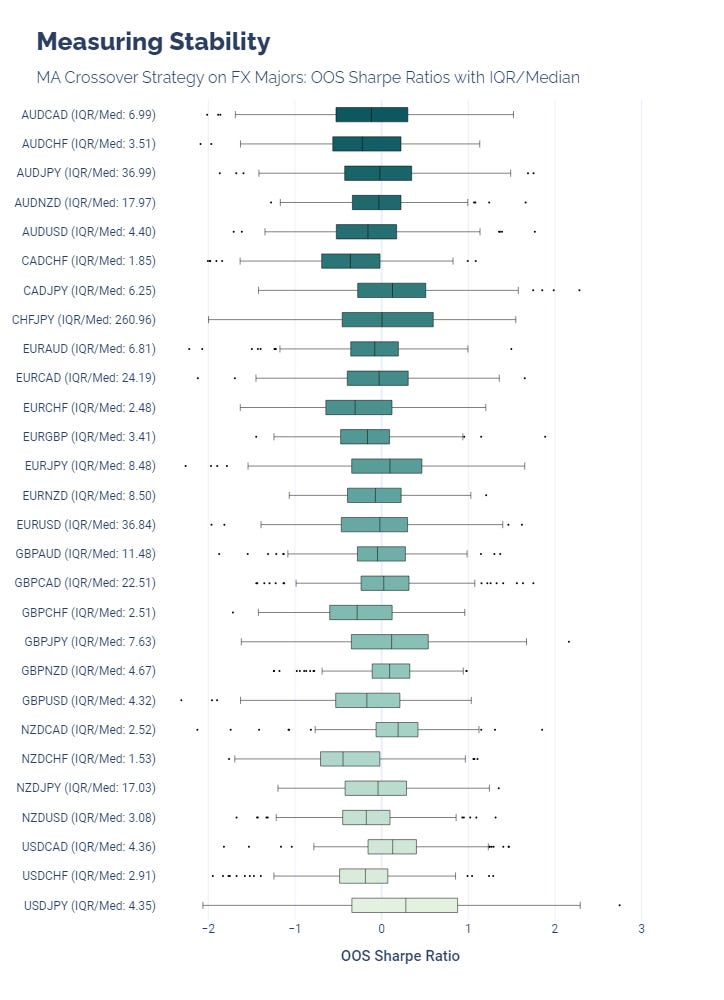
Variability can be measured with the Inter-Quartile Range / Median ratio. If we use this on our OOS results, we get a better idea of how consistent our strategy can be. One benefit of this metric is that it does not assume that our observations are normally distributed.
However, this metric also has drawbacks. It begins to vary wildly when the median is around 0, which makes it harder to compare and interpret.
This is shown with our MA crossover strategy, which resulted in Sharpe ratios centered on 0 for many FX pairs. Notice that the IQR/Med for CHFJPY is 260.96, which is impossible to interpret. We always should look at this metric in context.
Accuracy
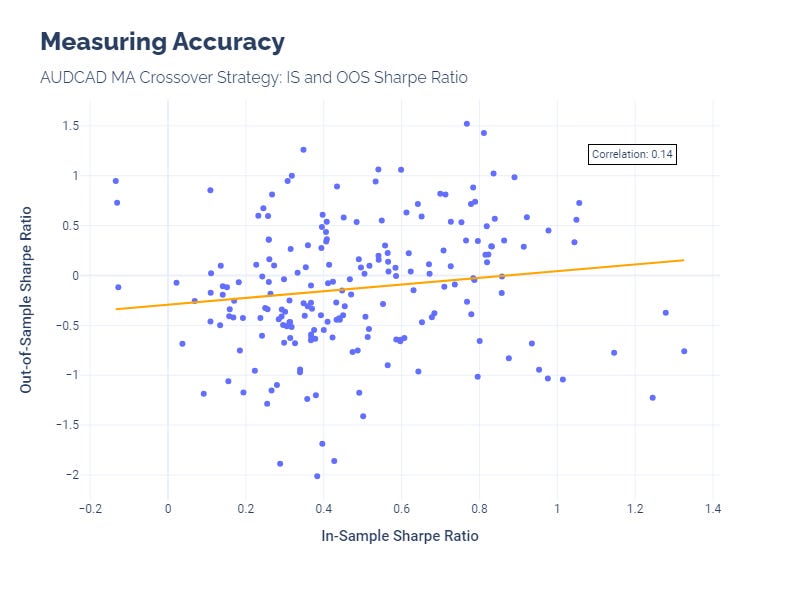
Accuracy, or generalizability, is assessed by examining the correlation between IS and OOS results. A strategy that shows high correlation between its IS and OOS performance is one that can adapt well to unseen data, making it a robust choice for future applications. This aspect of generalizability ensures that the strategy isn't overly tailored to the quirks of the historical data it was trained on.
If we take one FX pair, for example, we can visualize this measurement and see the weak relationship between IS and OOS Sharpe Ratios.
Finding Special Cases
We often see that a strategy performs much better on some securities than others. Running tests on many securities helps us find those outliers.
This crossover strategy does not have significant outliers, but the OOS performance does not remain consistent for all FX pairs.
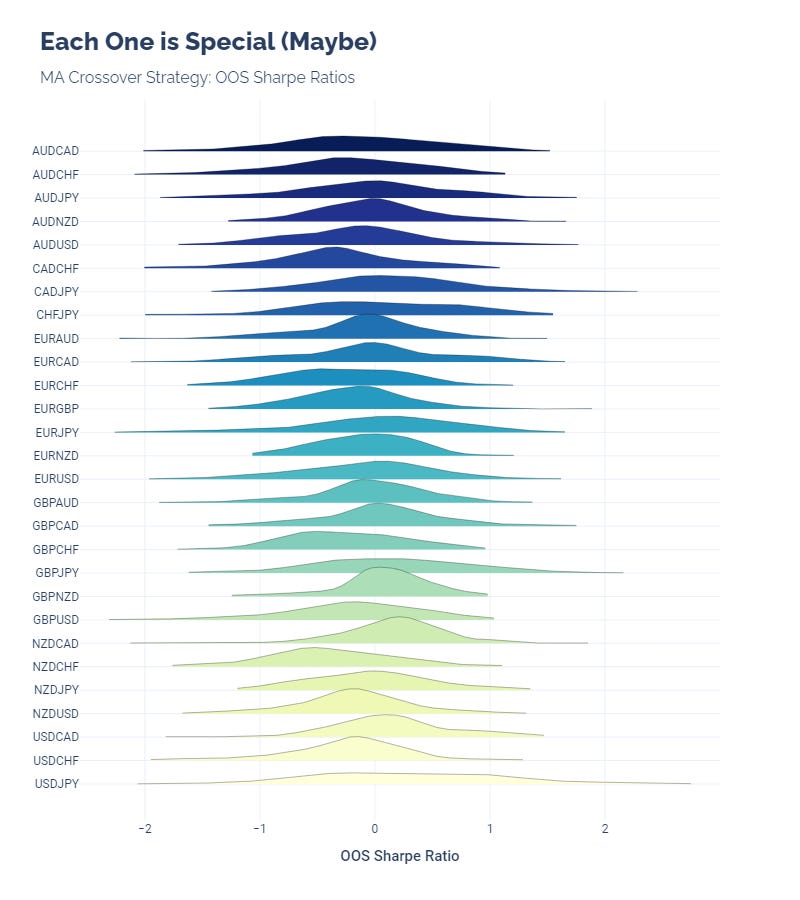
(Doing all of these gives us a good excuse to make ridgeline plots, too. Who doesn’t like pretty pictures?)
In sum, the rationale behind running millions of tests and simulations is not rooted in a desire for overkill but in a pursuit of excellence. It's about ensuring that when we do commit to a strategy, we do so with the confidence that it is not only promising in theory but proven in practice—across a variety of conditions and securities. This rigorous approach is what sets apart successful strategies from the vast sea of contenders, guiding us towards informed, data-backed decision-making in our trading.
Until next time, keep on the cutting edge, everyone.
Disclaimers
The content on this page is for educational and informational purposes only. Any views and opinions expressed belong only to the writer and do not represent views and opinions of people, institutions, or organizations that the writer may or may not be associated with.
No material in this page should be construed as buy/sell recommendations, investment advice, determinations of suitability, or solicitations. Securities investment and trading involve risks, and not all risks are disclosed or discussed here. Loss of principal is possible. You are encouraged to seek financial advice from a licensed professional prior to making transaction decisions.
Further, you should not assume that the future performance of any specific investment or investment strategy will be profitable or equal to corresponding past performance levels. Past performance does not guarantee future results.