Backtesting the Entire S&P 500
You read that right. Yes, we can do that.
In our posts so far, we have looked at strategy evaluations on small sets of securities. The set of 28 FX major pairs has been our go-to. That helped us get some very useful results already.
But, we know not everyone trades FX only. Our research should help a wider audience. We can do more. In this post, we will show an example of an R2T Backtest on the entire S&P500.
The Setup
Let’s look at a simple trend following strategy with filters and risk management:
Indicators used:
Exponentially-weighted Bollinger Bands
Triple Exponential Moving Average
Trading rules:
Buy when a stock’s price crosses the upper Bollinger Band from below and the Bollinger Band’s average is above the Triple Exponential Moving Average
Sell when a stock’s price crosses the lower Bollinger Band from above and the Bollinger Band’s average is below the Triple Exponential Moving Average
Risk management:
Trailing stop loss: 10%
The idea behind this strategy is to try and hone trend following signals with an MA filter confirming price action. The MA confirmation is a reduced crossover strategy - the Bollinger Band average is the “fast” MA, and the TEMA is the “slow” MA.
We will optimize using three parameters: Bollinger Band window, Bollinger Band alpha (number of standard deviations the upper and lower band are from the middle MA), and TEMA window. Let’s say we choose one parameter configuration for this strategy:
EW Bollinger Band window: 20 days
EW Bollinger Band alpha: 2
TEMA window: 50
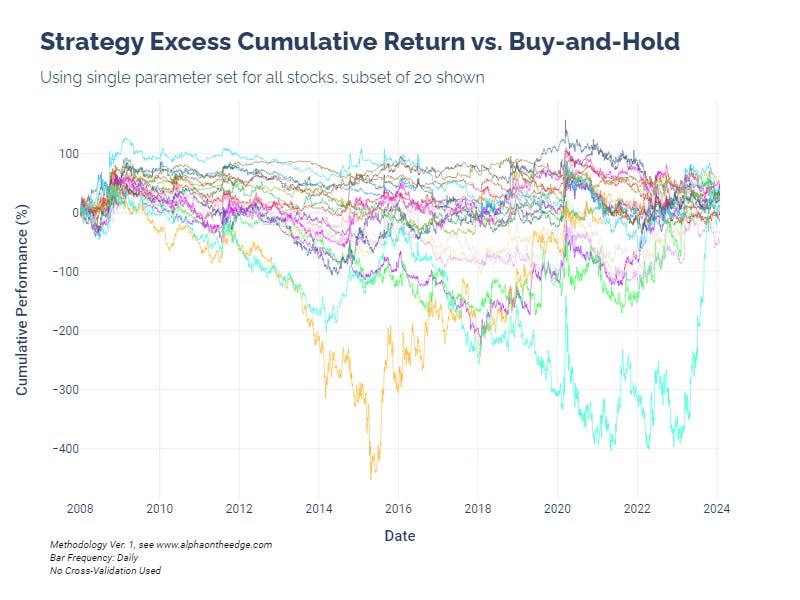
We can plot the excess cumulative return of the strategy vs. buying and holding each stock. This measures the additional return from trading actively instead of holding passively.
This uses only one parameter configuration, so we know we can do better. Let’s go to ludicrous speed.
86 Million Simulations on the S&P 500
We want to measure our strategy’s performance using our R2T Backtesting Framework. For each stock, we choose cross-validation sets of in-sample and out-of-sample time periods and simulate the strategy’s performance with every parameter configuration we want to test.
Our parameter space for this test:
BBand window: [20, 25, 30 … 50]
BBand alpha: [0.5, 1.0, 1.5, 2.0]
TEMA window: [30, 35, 40 … 200]
(Note: To ensure that the use a fast/slow MA filter, we only use parameter combinations where the TEMA window is at least 5 days longer than the BBand window.)
How many simulation is this?
1000 unique parameter combinations x 432 stocks with history since 2007 x 200 CV splits for each stock = 86.4 million simulations
Results
We use cross-validation on each stock. For each CV set, we find the optimal in-sample parameter configuration and simulate strategy execution on the paired out-of-sample period with that optimal configuration.
This evaluation methodology allows to avoid curve-fitting and get a truly comprehensive set of results. We come out with a clear picture of how well the strategy performs in many market regimes across a large stock universe.
We can summarize all of these simulations with the below metrics table, which uses median metrics as well our stability and accuracy metrics.
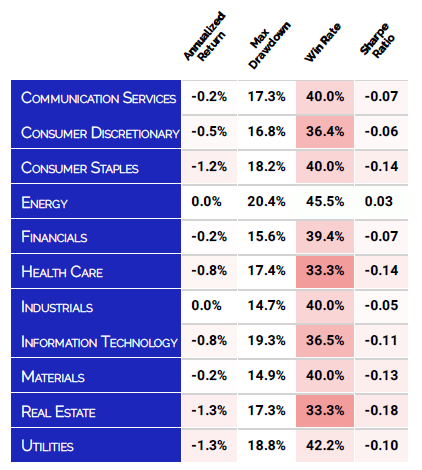
This strategy is obviously not very impressive on the entire stock set, but we can also break this down by sector!
Now that’s pretty cool. We can see some variation in sectors, even though the cross-validated strategy performance is still underwhelming. Let’s visualize the OOS Sharpe ratios by sector to get an idea of the distributions:
With such mediocre results, was all this effort wasted?
Absolutely not.
These results are just as useful as good results. Algorithmic trading is about knowing what strategies to avoid as much as what strategies to use. We aim to arm traders with this knowledge to save time and reduce losses. That makes even mediocre results incredibly valuable.
Looking Forward
We are really excited to share more research on algorithmic trading at this scale. We believe that strategy evaluation needs to be as honest and comprehensive as possible. Future posts on Alpha on the Edge will cover additional strategies and evaluate using other universes such as commodity futures and ETFs.
Until next time, keep on the cutting edge, everyone.
Resources:
Disclaimers
The content on this page is for educational and informational purposes only. Any views and opinions expressed belong only to the writer and do not represent views and opinions of people, institutions, or organizations that the writer may or may not be associated with.
No material in this page should be construed as buy/sell recommendations, investment advice, determinations of suitability, or solicitations. Securities investment and trading involve risks, and not all risks are disclosed or discussed here. Loss of principal is possible. You are encouraged to seek financial advice from a licensed professional prior to making transaction decisions.
Further, you should not assume that the future performance of any specific investment or investment strategy will be profitable or equal to corresponding past performance levels. Past performance does not guarantee future results.


