
Fun in the Zoo: Exploring 50 Crypto Drivers

Today, we’re returning to the market driver framework with a couple of updates:
Additional volume metrics
A new category called “Sensitivity”
Results for a huge set of 50 drivers
There’s a commonly cited criticism of market factor (what we call market driver) research - the huge number of them create a “factor zoo.” This term comes up a lot in research because so many factors are redundant, have little explanatory power, and lack robustness. In other words, why do we need so many?
In this post, we will discuss that question after briefly introducing measurements of volume activity and sensitivity. Let’s explore the zoo!

Volume and Sensitivity
If you need a recap of our market driver framework, see this post:
Introduction to Market Drivers
Traders have long found signals in trading volume, which is like the pulse of activity from buyers and sellers. Volume acts as a strong complement to price activity and can signal trends, reversals, and the intent of large investors. There are a few helpful volume indicators we are using here:
On Balance Volume (OBV) - OBV measures the flow of volume in a positive or negative direction. This indicator cumulatively adds volume on days the price finishes up and subtracts volume on days it ends down, painting a picture of whether money is flowing in or out. A rising OBV suggests buyers are willing to step in and push prices higher, while a falling OBV indicates sellers are in control, possibly leading to lower prices.
Accumulation/Distribution (AD) - AD takes a broader sweep, combining price movement and volume to determine whether a stock is being "accumulated" (bought heavily) or "distributed" (sold heavily). It’s akin to tracking footprints in the sand, showing where the market's big players are moving, often ahead of price changes.
Klinger Volume Oscillator (KVO) - The KVO is the detective of the volume world, uncovering the story behind the price movements by comparing high-volume to low-volume days. It aims to predict the direction of the trend by detecting divergences between volume flow and price. The KVO oscillates around a zero line, with readings above zero possibly signaling bullish trends, and vice versa for readings below zero.
We would expect long/short portfolios with these metrics to have high correlation, right? Sounds like these would be redundant.
Another important category of measurements looks at how returns respond to changes in other data. For example, if the price of oil increases, what would happen to the price of bitcoin? Measuring the sensitivity of bitcoin to oil can be accomplished a number of ways. We are using “beta” - the coefficient from a single linear regression model - to measure this sensitivity. A higher beta means that a higher change in the price oil would be associated with a higher change in the price of bitcoin.
Here’s why this is useful. If you expect the U.S. Federal Reserve to lower the Federal Funds Rate and expect short-term yields to decrease, you could have information on what might happen to the price of a coin or stock. It’s not an exact prediction, but as we’ll see, the sensitivity can matter in times of change.
Crypto Top 50 Market Driver Performance
Now that we have described the additions to our zoo, let’s have a look around. We have a total of 50 drivers, and this giant bar chart show the performance of all 50 for the 4 weeks ending April 5, 2024:
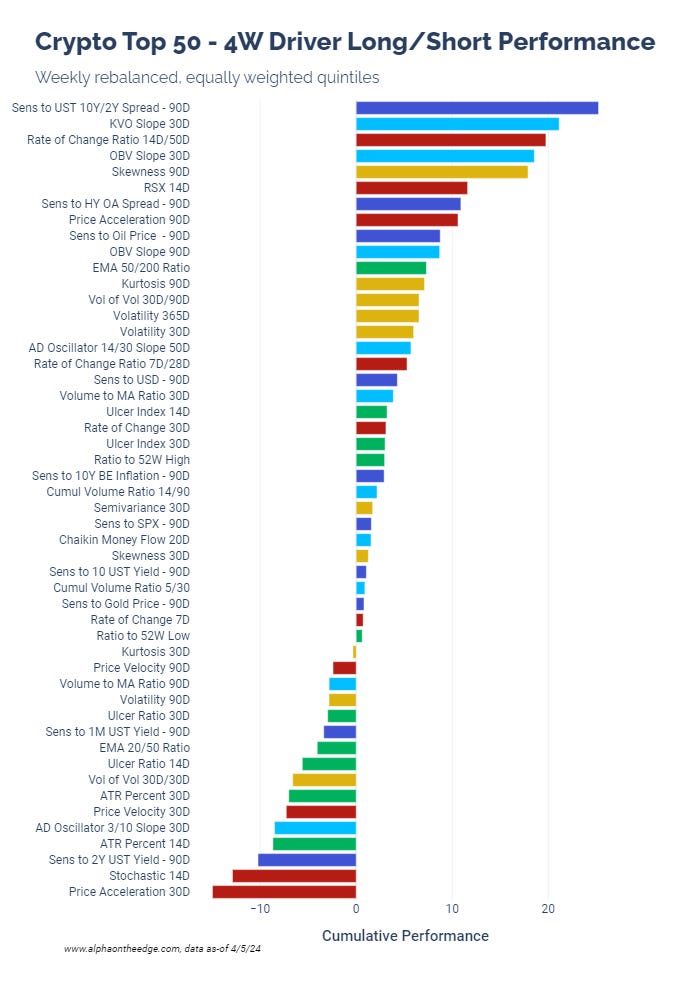
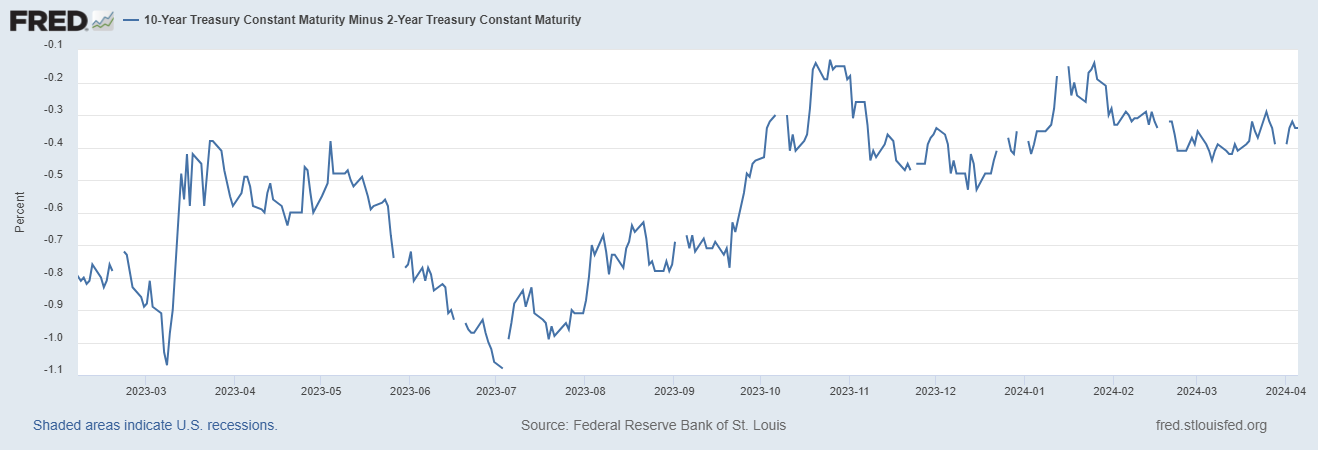
The 2s10s spread has been a huge driver in the last 4 weeks. This means that a portfolio concentrating on coins with historically high sensitivity to a steepening yield curve outperformed. It’s not just that we’ve seen a recently steepening yield curve, but that the coins with the highest sensitivity did very well.
Additionally, our volume drivers have done very well recently. But, they aren’t as correlated as one might think. The short-term KVO and OBV rates of change did well, but the short-term AD Oscillator did not.
Here’s a giant table to go with the giant bar chart:
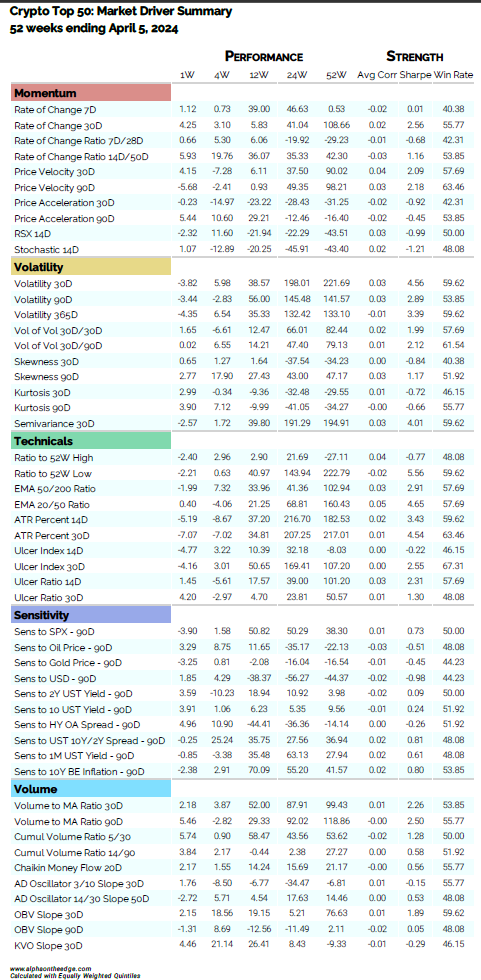
Different stories emerge as we expand the horizon to 52 weeks. Volatility was a more significant driver in the one year time period. However, sensitivity to the yield curve shows some predictive possibility even over 52 weeks - the 2s10s spread had an average correlation of 0.02 over the period.
Our volume drivers have mixed performance over the extended time period, and most do not show significant average correlations. However, they clearly constructed diverse portfolios, despite the on-face similar metrics used.
To drive this home, let’s look at the giant correlation heatmap:
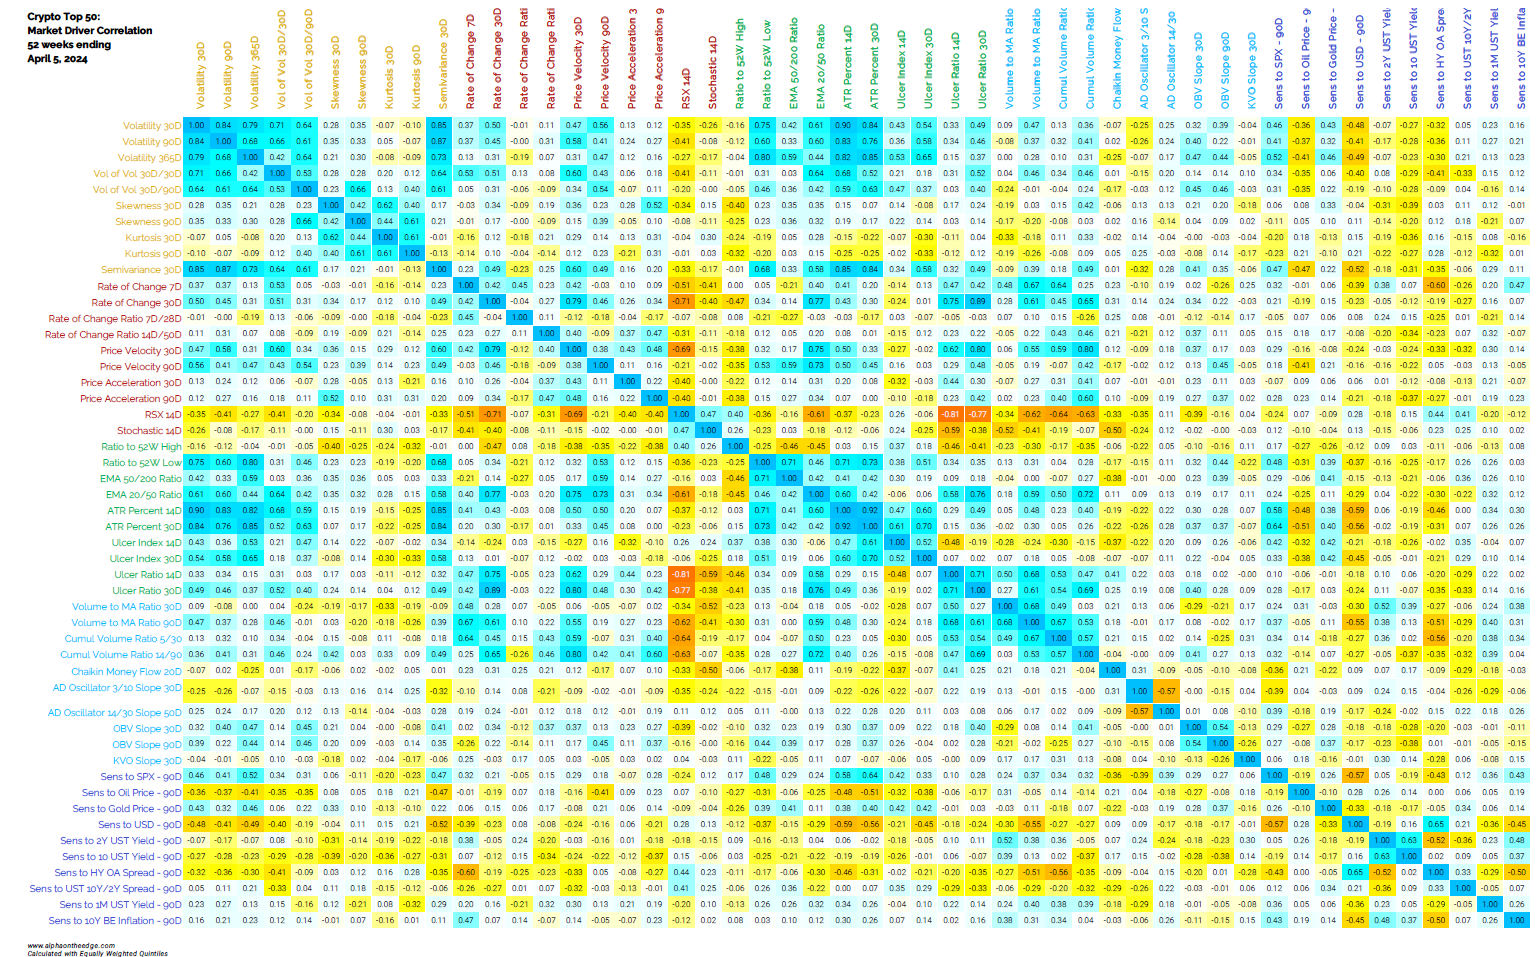
Is this zoo overgrown? Is this an information overload?
Yes. A 50x50 correlation matrix is just too much, as is a 50-row performance table.
But does that mean we have redundant drivers?
Not quite - the varying correlations and results suggest that it might be worth tracking these regularly if not looking at the results in depth. Meaning, we don’t have to look at a giant correlation matrix every time we run this analysis.
Even still, the fact remains that our market driver framework reveals some interesting insights. We will stick with this for a little while longer and look at the equity markets next time.
Until next time, keep on the cutting edge, everyone.
Disclaimers
The content on this page is for educational and informational purposes only. Any views and opinions expressed belong only to the writer and do not represent views and opinions of people, institutions, or organizations that the writer may or may not be associated with.
No material in this page should be construed as buy/sell recommendations, investment advice, determinations of suitability, or solicitations. Securities investment and trading involve risks, and not all risks are disclosed or discussed here. Loss of principal is possible. You are encouraged to seek financial advice from a licensed professional prior to making transaction decisions.
Further, you should not assume that the future performance of any specific investment or investment strategy will be profitable or equal to corresponding past performance levels. Past performance does not guarantee future results.