
How to Win with Stocks: Be the Market
Unless the market isn't doing so well, that is

Welcome back everyone, and welcome to the second quarter of 2024. The S&P is ripping, Bitcoin is sideways, and we have been focusing on a toolkit that helps explain why.
We’re looking more at market drivers and pivoting from crypto to stocks in this post. Explaining the stock market is a different endeavor than explaining the crypto market, after all. We should not assume that the same drivers are propelling both asset classes.
In this post, we will take our set of drivers and see what has and has not been helping stock performance over the past year. Along the way, we will ruminate on why it has paid to be one with the market. It pays to be the house when the house wins, after all.

Stock Market Drivers
Let’s begin with the one year performance of the top/bottom 10 drivers from our set of 50:

As a quick recap - We are looking at the performance of strategies that measure an attribute of all stocks in the S&P500, buy the top 100, short the top 100, and repeat this every week. We have moved from the top 50 cryptocurrencies into the equity markets but are using the same driver set.
(Sidebar: Research on drivers/factors in stocks is far more developed than that in the crypto markets. Our set leaves out significant drivers with mountains of research purely to create a throughline in our posts. That is, our analysis here is meant to compare performance drivers between asset classes in addition to performance drivers for a single asset class.)
The top performing strategy was what we call “sensitivity to the S&P500.” This is also known as “market beta.” It basically says if you’re a company with a stock price that moves with the market, you do well when the market does well.
It’s worth taking a moment to think about that. The S&P 500 Index is a market cap weighted index, which means that the largest companies dominate the index’s returns.
This is shown in this great post from Statista:
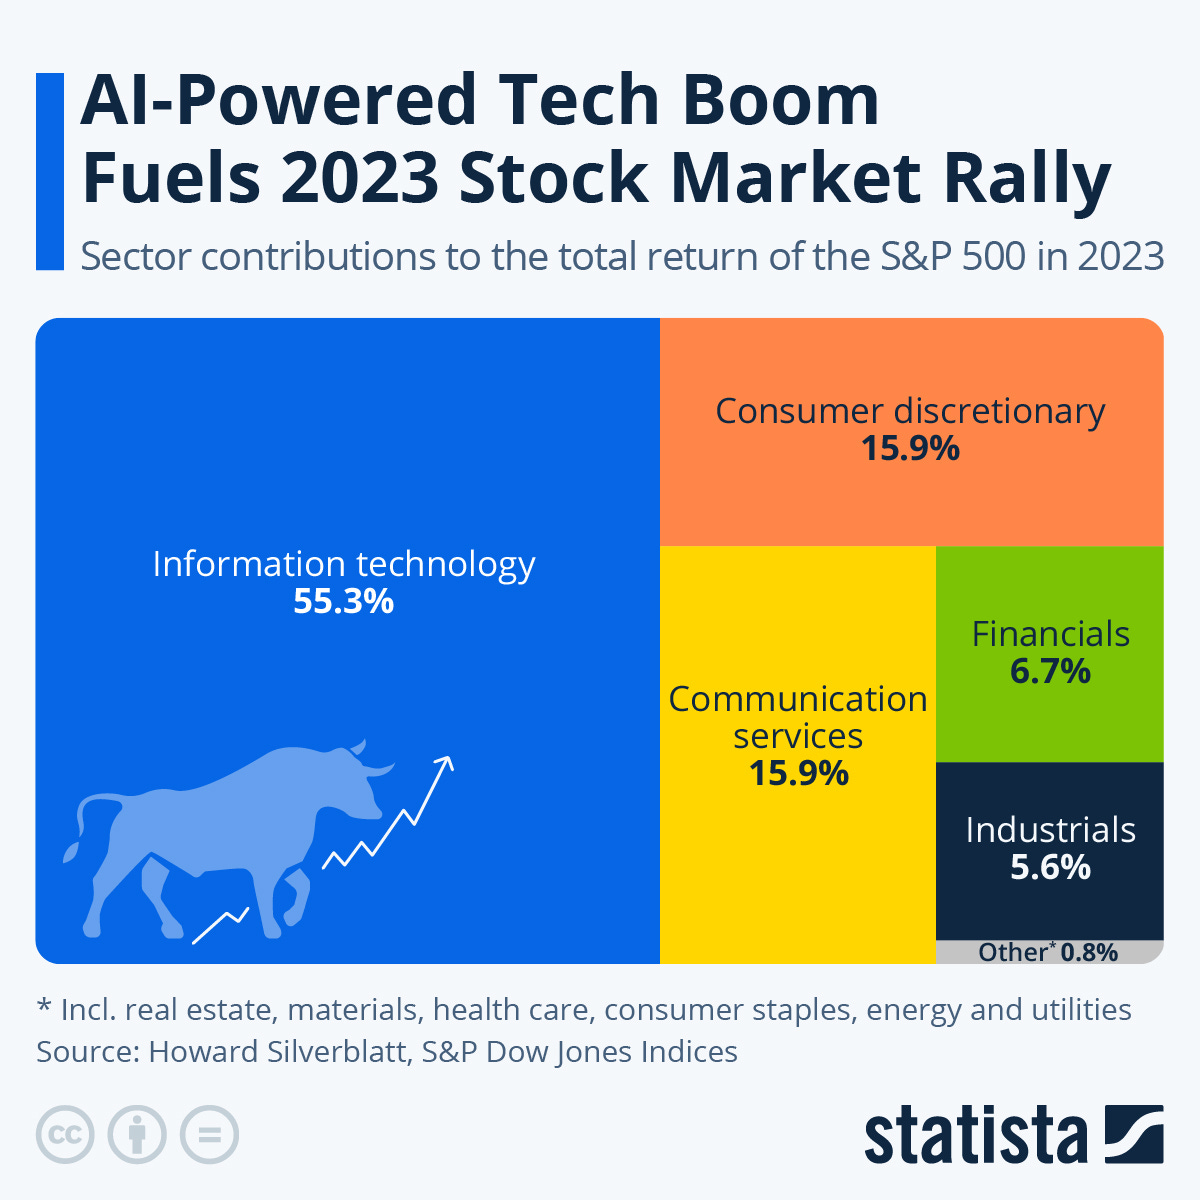
So if you are the market, you do well when the market does well. And if you owned IT and communication services stocks in 2023, you probably did very well.
But our driver framework reveals something more interesting. Recall that our strategies here are buying the top quintile of stocks and equal weighting them. This means that even when removing company size from the equation, a stock’s sensitivity to the market as a whole captured more upside than any other driver in this set.
The story doesn’t end there, however. The stock market’s value isn’t a monotonically increasing series, so simply owning high-sensitivity (high-beta) stocks won’t guarantee your fortune here. Indeed, looking at the last 4 weeks:
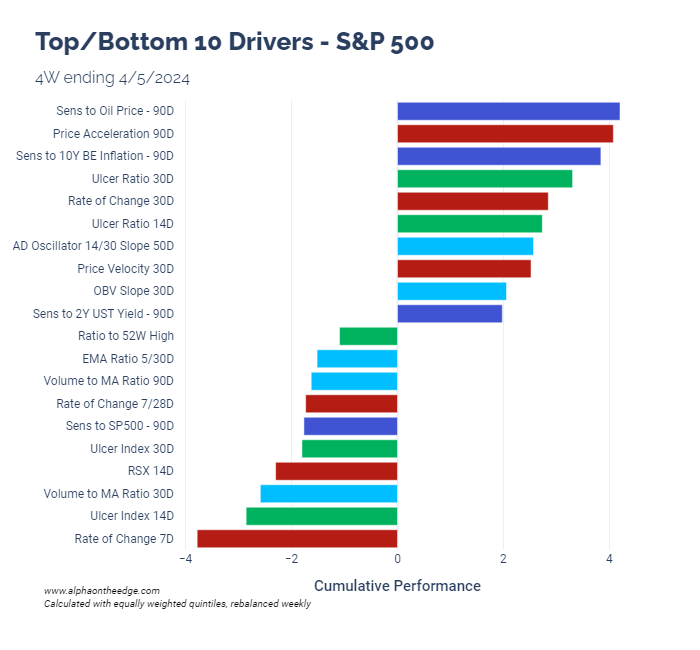
In the last 4 weeks, the story has shifted more to oil and momentum.
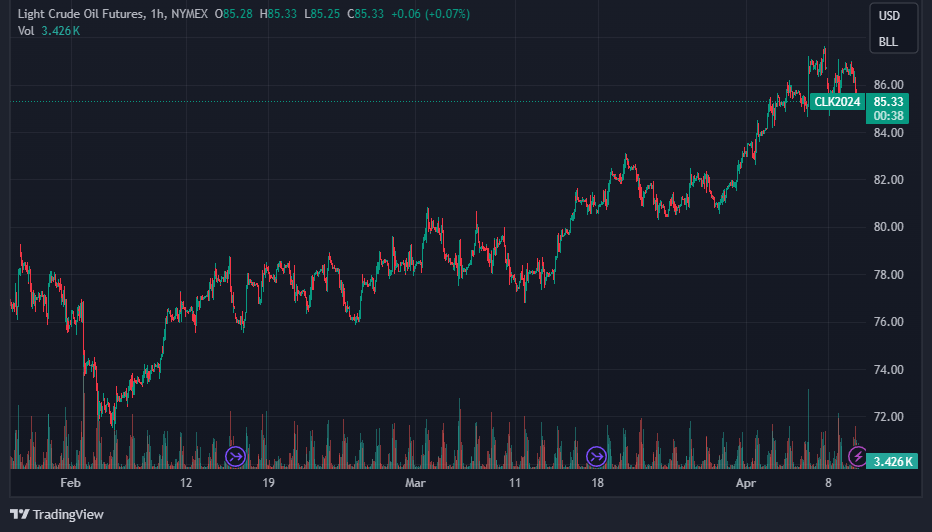
So the winners were the plays on oil:
Thinking back to our last post, this was not the case with crypto. Oil sensitivity was in the top drivers of crypto for the same period, but the top driver was sensitivity to changes in the steepness of the US treasury yield curve. In other words, stock portfolios wanted oil exposure, crypto portfolios wanted yield curve exposure.
With the S&P500, we can see that high momentum stocks also did well, but only for certain kinds of momentum. 90D acceleration and 30D rate of change performed well, but 7D rate of change did not. Longer-term momentum was the high flier, in this case. At some point, I’d like to look more at momentum, because it has tons of research supporting it but isn’t the most popular investing style.
Finally, let’s look at our giant summary table:
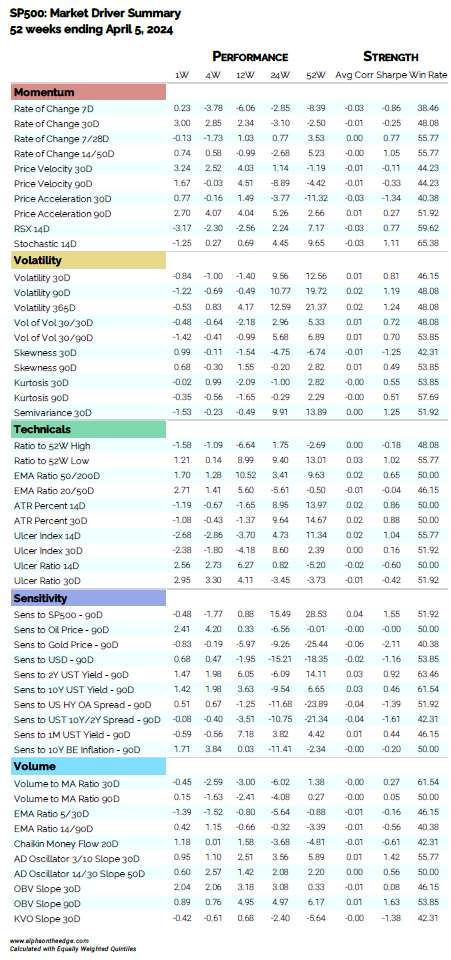
What stands out to me is the set of return correlations for the set of sensitivity drivers. A good rule of thumb is that an average correlation above 0.02 or below -0.02 is a significant signal. We have 0.04 for SP500 sensitivity and -0.06 for gold sensitivity, both significant readings.
We didn’t see this with crypto. With crypto, the significant return correlations came with technicals, volatility, and momentum drivers.
Another reason the driver framework is so powerful is it helps us give language to the differences between asset classes. Here, we see stocks connecting with certain “themes” - tech/AI, commodities, and credit markets. With crypto, the story has been more about price action. Even though sensitivity to the steepening yield curve was the highest performing driver for crypto, that had less correlation on average with asset returns than price action drivers did.
We have stayed with the market driver framework for a while now because of its power and versatility. What this framework lacks in mathematical rigor it makes up with its interpretability. It’s very easy to explain and reveals many insights for it.
In other words, given that we all learn from stories, this market driver framework is instructive because of the stories it tells.
Until next time, keep on the cutting edge, everyone.
Disclaimers
The content on this page is for educational and informational purposes only. Any views and opinions expressed belong only to the writer and do not represent views and opinions of people, institutions, or organizations that the writer may or may not be associated with.
No material in this page should be construed as buy/sell recommendations, investment advice, determinations of suitability, or solicitations. Securities investment and trading involve risks, and not all risks are disclosed or discussed here. Loss of principal is possible. You are encouraged to seek financial advice from a licensed professional prior to making transaction decisions.
Further, you should not assume that the future performance of any specific investment or investment strategy will be profitable or equal to corresponding past performance levels. Past performance does not guarantee future results.
Thanks, really interesting.
How do I get the code to backtest all that info?