
More on Market Drivers: The Year of Volatility?
The surprising performance of volatility portfolios in crypto

Now that we have looked at the basics of market drivers, it’s worth diving deeper because there are some surprising patterns that can be found with the market driver framework. We will stick with our own “Crypto Top 50” for a little while longer because this might help contribute to the growing interest in crypto market factors.
This round, we have expanded our collection of drivers from 3 to 21, so we have a better set of results to look at. It’s worth casting a wide net with crypto, as there has not been much research on the space yet. Our large set of drivers balances looking at too few drivers and looking at too many.
We will do a quick recap of the framework we are using then discuss recent performance of market drivers in crypto.

Quick Recap - Market Drivers
The market driver framework we use involves backtesting rules-based portfolios that concentrate investment in a certain attribute of a cryptocurrency, like volatility or momentum. Our portfolio strategy is to buy the “best” coins according to the attribute and short the “worst” coins.
Take the measurement of price acceleration, represented by an approximated second derivative of daily prices. This is one way to quantify a coin’s price momentum. Our hypothetical portfolio buys the coins with the most price acceleration and shorts the coins with the least price acceleration. We are concentrating our conviction in a specific investment thesis - accelerating price means higher momentum means higher returns for our portfolio.
We assume that we repeat this every week, rebalancing into the best/worst coins every Friday. We’re looking at quintiles in this analysis. That means our strategy will go long 10 coins and short 10 coins each week.
The results we will discuss take 21 attributes, backtest the associated strategies, and report the performance of the hypothetical portfolios with this strategy. In a way, this is a set of measurements reporting the success of specific investment theses over a given timeframe.
Driver Performance Results
Let’s start with the 4-week performance as of March 29, 2024:
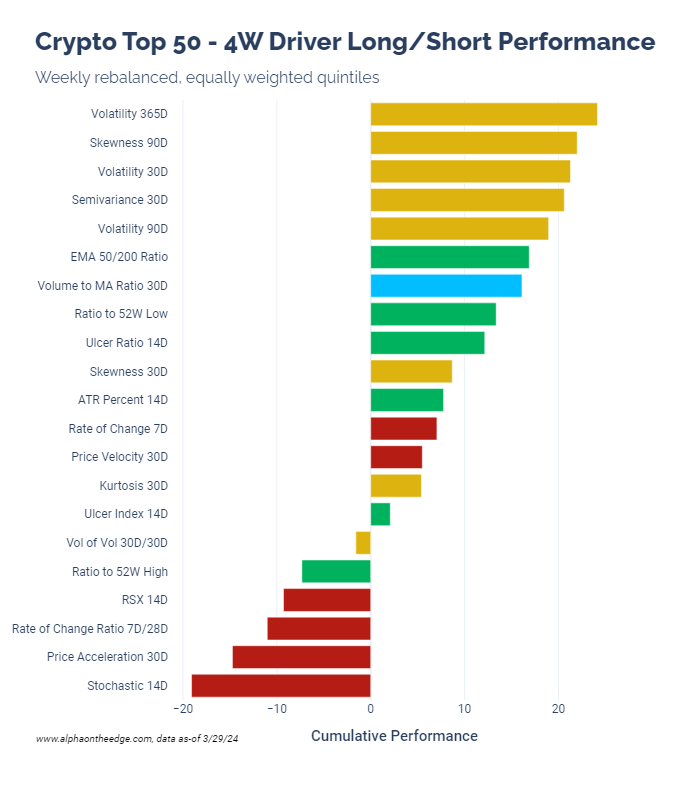
First, let’s talk about the colors of the bars. This is a useful way to visually group similar drivers. We currently have four categories:
Momentum (Red)
Volatility (Yellow)
Technicals (Green)
Volume Activity (Light Blue)
This is neither an exhaustive nor definitive list of categories. “Momentum” and “Technicals” can be very fuzzy categories, for example. Further, there is another category to be added to our set here, which we will talk about in the near future.
Let’s look at the top performer: “Volatility 365D”. What this is reporting is how well someone investing in volatile coins performed over 4 weeks. Every Friday, this portfolio goes long the 10 coins with the highest volatility over the last year, and short the 10 coins with the lowest volatility.
This simple strategy, along with four other simple strategies built around volatility measures, performed incredibly well over the 4 weeks.
It’s fascinating how some drivers will have periods of excellent performance and periods of underperformance. This is clearly not the time to look at common measures of momentum, for instance.
It’s also interesting to note that while straight volatility performed well, the “Vol of Vol” portfolio did not. Meaning that concentrating on the volatility of volatility would not have been a good strategy. The best drivers were consistent volatility, not inconsistent volatility.
Let’s look at a more detailed performance summary:
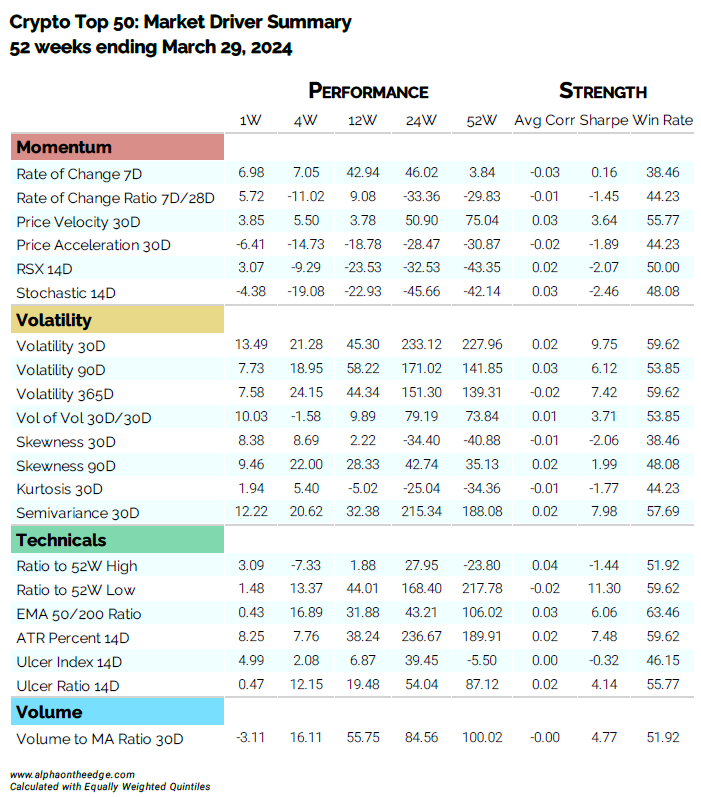
Even more to unpack here. We see the color-coded categories again, which helps us continue to group drivers. The performance columns report the numerical cumulative performance. The 4W columns is the same data from the earlier bar chart.
(Quick sidebar - isn’t that a beautiful table? That’s completely custom work with pandas! I’m proud of this one.)
The “Strength” columns are mostly familiar to us at this point. “Avg Corr” is the average correlation of a driver value with the forward returns. It’s one way to measure the predictive value of a driver. Values around 0 are common. A general rule of thumb is that values above 0.02 and below -0.02 are significant.
“Sharpe” is the strategy’s annualized risk-adjusted performance, and the “Win Rate” here is the percentage of weeks with positive performance.
Looking at this table, we can see many conflicting pieces of information. The “Volatility 365D” strategy has high performance but negative correlation with forward returns. This indicates that the performance over the past year could have been more luck.
Conflicting measurements are common in market driver research, so we take notice when the signals line up. “Volatility 30D” achieved extremely high performance, has a high win rate, and a high correlation with forward returns. That is noteworthy. It doesn’t mean we should all go start buying volatility. Drivers can be inconsistent, but it is worth watching these in the future.
Finally, let’s look at cross-driver correlation:
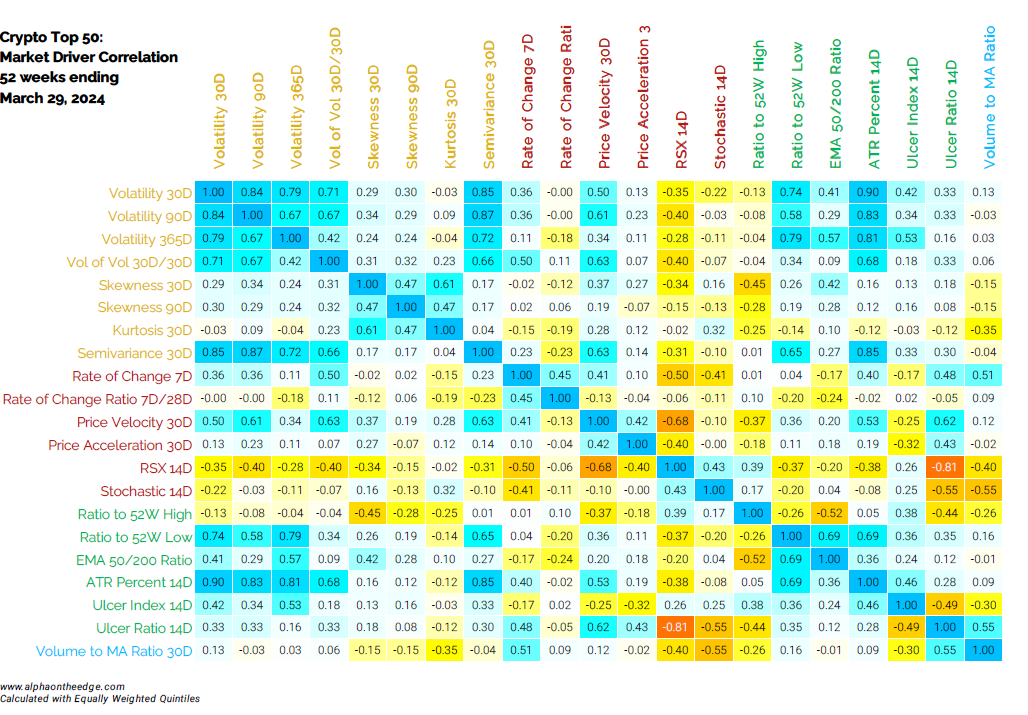
(Another beautiful table, right? We’re on a roll with this post!)
The other fascinating part of driver analysis is the diversification potential. Volatility is understandably correlated with volatility, but not with all strategies. And some momentum strategies, for example, have very low correlation with all categories of drivers. This tells us that volatile coins tended to not have momentum in the past year.
A big takeaway is that volatile coins has a very, very good year. Volatility wasn’t the only driver of the crypto markets, but it was a major one.
We will spend some more time looking at market drivers in our next posts, including drivers in the equity markets. Always more to find here.
Until next time, keep on the cutting edge, everyone.
Disclaimers
The content on this page is for educational and informational purposes only. Any views and opinions expressed belong only to the writer and do not represent views and opinions of people, institutions, or organizations that the writer may or may not be associated with.
No material in this page should be construed as buy/sell recommendations, investment advice, determinations of suitability, or solicitations. Securities investment and trading involve risks, and not all risks are disclosed or discussed here. Loss of principal is possible. You are encouraged to seek financial advice from a licensed professional prior to making transaction decisions.
Further, you should not assume that the future performance of any specific investment or investment strategy will be profitable or equal to corresponding past performance levels. Past performance does not guarantee future results.