
Triple Threat!: Triple RSI vs Triple RSX
One more look at the RSX

In our last post, we looked at replacing the time-honored, well-known Relative Strength Index (RSI) with Jurik Research's Relative Strength Quality Index (RSX). The RSX is smoother than the RSI and still maintains the RSI's responsiveness to price movements.
We tested 8 variants of the classic RSI reversal strategy on SPY and compared the results with using the RSX in the same strategies. There was evidence that the RSX versions were both more consistent and better performing for most variants.
In a coincidence of good timing, our friends at Quantified Strategies posted a Triple RSI trading strategy a few days before my RSI vs. RSX post was published. So, naturally, I wanted to test out the RSX version of that strategy!

The Triple RSI Strategy
The trading rules are as follows:
Buy when the following criteria are met:
5 day RSI < 30
5 day RSI has decreased for 3 bars in a row
5 day RSI was below 60 as of 3 bars in the past
Closing price is higher than the 200 day moving average.
Sell when the 5 day RSI crosses above 50
The folks at QS found some compelling results when backtesting on SPY, so lets see how the Triple RSI does on the stocks in the S&P 500 Index and compare with our own Triple RSX version!
Triple RSI vs. Triple RSX on S&P 500 Stocks
Quick bit of housekeeping before diving in. The backtests here differ from QS in a couple ways:
Our backtests assume that buy and sell orders are made at the open price of the next bar, where QS uses the close of the signal bar
Our backtests assume a small amount of slippage and fees
(See our backtesting methodology for more info)
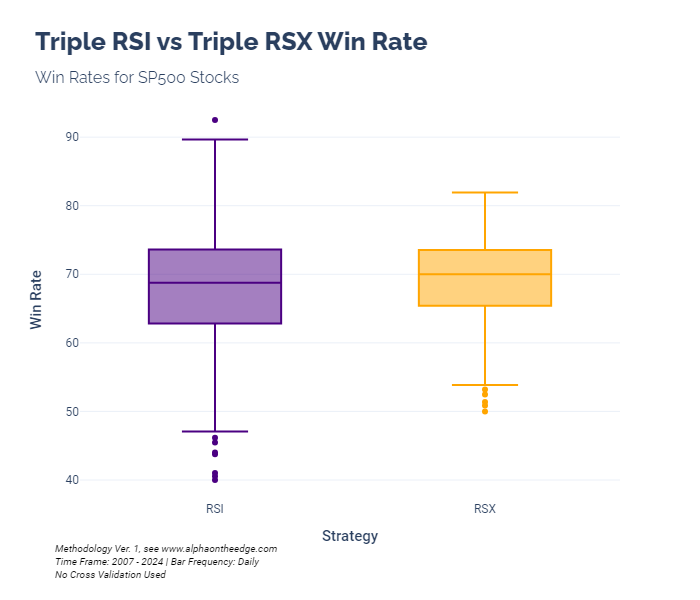
Looking first at win rates, we see a similar pattern to our first tests on the RSX. The RSX has a narrower range of win rates, indicating a higher level of consistency. So it does not result in outliers as much as the RSI. What's new here is that the median win rate of the Triple RSX is a little higher than the Triple RSI.
And because we are using he stocks in the S&P 500, we can break this down by sector, as well:
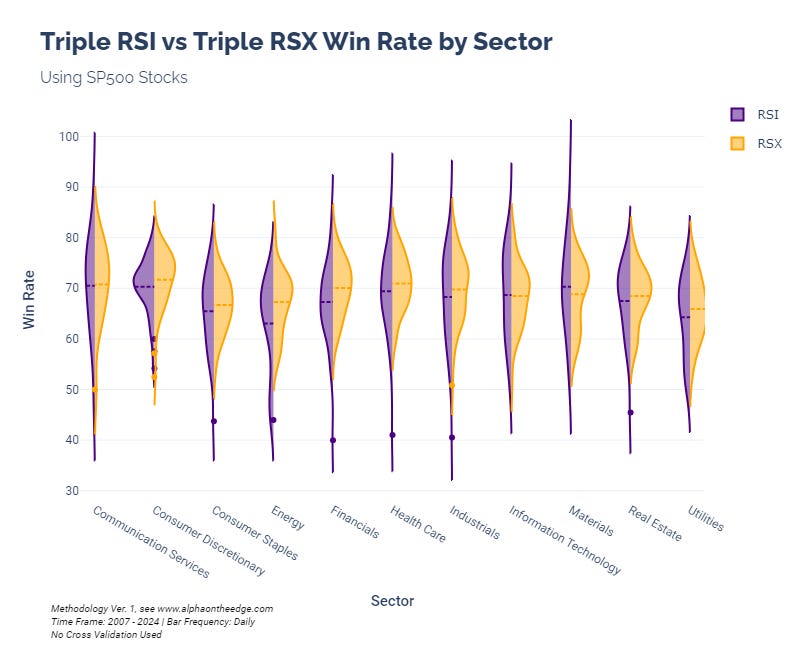
The Triple RSX achieved higher median win rates in 9 out of 11 sectors, which is very compelling. We see large differences in energy and financials, especially.
Let's look at the win rate vs expectancy:
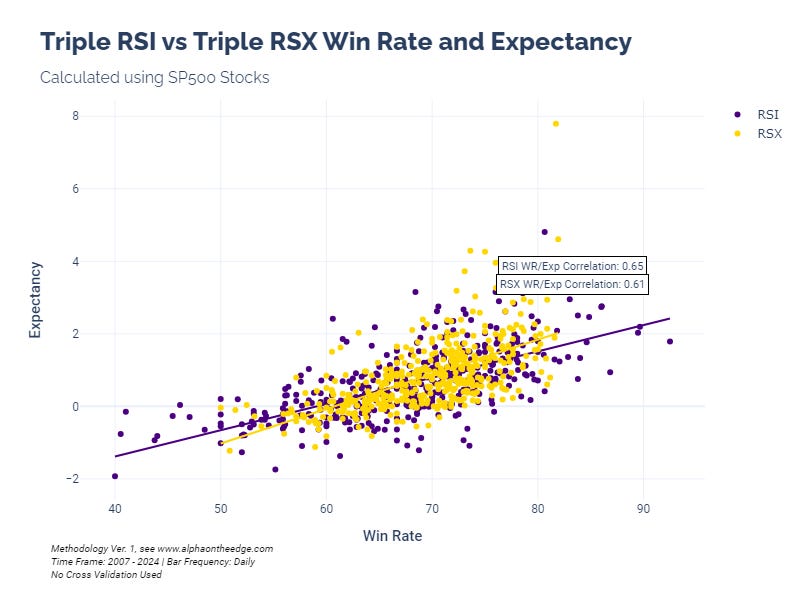
We again see that the Triple RSX results are more clustered (with one interesting exception, back to that in a bit). However, the Triple RSX has a slightly lower correlation between win rate and expectation - 0.61 for Triple RSX vs 0.65 for the Triple RSI.
And since we have sectors split out, any pattern in the sectors here?
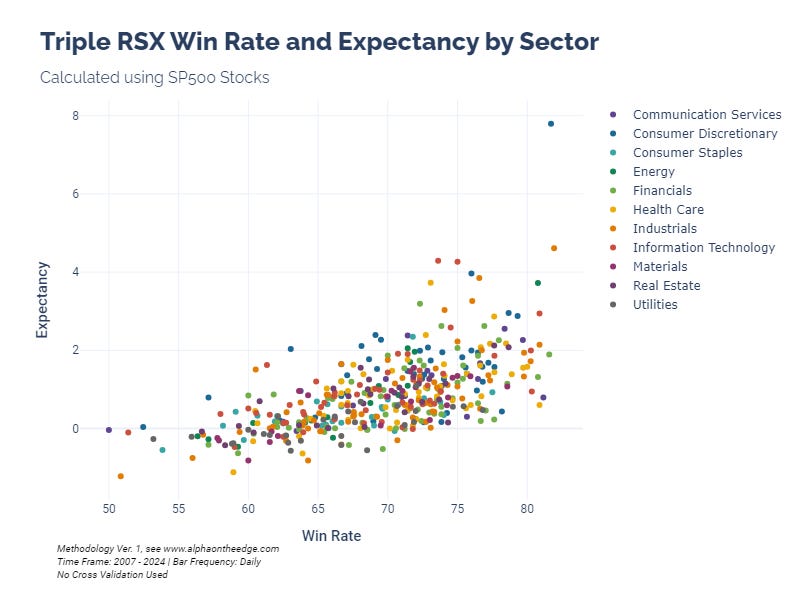
Not really.
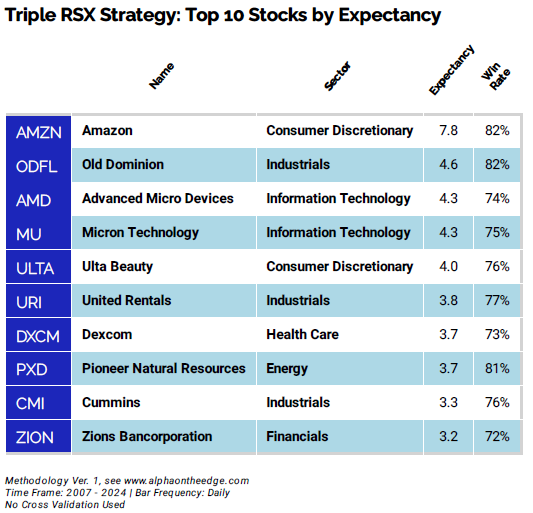
But the outliers here look very interesting! So here are the top 10 Triple RSX stocks ranked by expectancy:
Conclusion
We have additional evidence that the RSX is a superior choice than the RSI. The Triple RSX strategy results in more consistent win rates that tend to be higher than those achieved by the Triple RSI strategy. So, the RSX gives us a smoother indicator as well as a better strategy.
As a side bar, I promise that this is not some marketing for Jurik Research! I am honestly surprised that a custom version of the RSI performs so well. It gives me more respect for JR, and I’m now curious about their other custom indicators.
Until next time, keep on the cutting edge, everyone.
Resources
The R2T Backtesting Framework, Ver. 1
Disclaimers
The content on this page is for educational and informational purposes only. Any views and opinions expressed belong only to the writer and do not represent views and opinions of people, institutions, or organizations that the writer may or may not be associated with.
No material in this page should be construed as buy/sell recommendations, investment advice, determinations of suitability, or solicitations. Securities investment and trading involve risks, and not all risks are disclosed or discussed here. Loss of principal is possible. You are encouraged to seek financial advice from a licensed professional prior to making transaction decisions.
Further, you should not assume that the future performance of any specific investment or investment strategy will be profitable or equal to corresponding past performance levels. Past performance does not guarantee future results.