
Why Macro Matters, and How to Use It

For a lot of traders, macroeconomics doesn’t matter until it suddenly matters for everyone. When inflation is ravaging consumer buying power, or when spiking treasury yields are driving up mortgage rates and depressing new home sales - it’s hard to pivot on a dime and suddenly account for macro forces.
It’s best to stay aware of and ahead of macro trends. When we were looking at crypto market drivers, for example, we saw that sensitivity to the US treasury yield curve steepness was a key driver of market returns.
How do we measure these sensitivities and stay on top of them? In this post, we will look at our method of choice, a very simple application of linear regression.

Sensitivity and Regression
Our goal is to estimate how a change in one variable affects a stock’s returns. For example, let’s consider yields on 10-year U.S. treasury bonds. If yields increase 0.01%, can we say how much a stock’s return will change?
To do this, we look at a simple linear regression model:
(For a good explainer on simple linear regression, I recommend this guide.)
The theory and practical applications of linear regression are extensive and very elegant. This model helps quantify exactly what we are looking for - how a change in a variable (x) affects another variable (y). The beta term (coefficient, sensitivity, or exposure) the amount of change in y we would estimate would occur for a one unit change in x.
Back to our question of yields and stocks - say we estimate a linear regression model with a beta of 0.3. This would tell us that a 1% change in yields would see a 0.3% increase in a stock’s returns.
We can’t claim that yields cause the change in a stock’s returns, nor can we claim that such a model has unimpeachable predictive power (it doesn’t). Meaning, this is an inexact method simplifying complex statistical modeling techniques.
But here’s the good news - the observations this technique gives us can lead to some powerful insights, especially if we look at sensitivity in aggregate or over time.
Regression in Practice
One way to use regression is to measure a stock’s sensitivity over time. We can use a rolling window of returns and yields and estimate a linear regression model. Meaning, we estimate a model on one day with the previous n returns and yield changes, move to the next day, and do again. We would then have a time series of regression betas, one for each model we estimated.
Let’s look at the stock in the S&P500 with the highest sensitivity to 10 year treasury yields as of the end of March - Progressive Corp PGR 0.00%↑ . We want to look at:
Is the sensitivity to yields always high?
How quickly does the sensitivity change?
Is there a trend that we can identify?

So our estimated model tells us that at the end of March, a 1% change in US Treasury yields historically is associated with about a 5.5% increase in PGR’s returns. However, we can easily see that PGR’s sensitivity to yields is not always high - it was negative at the beginning of 2023. We also see that the sensitivity does not typically change so dramatically that we would expect negative betas in the next week. The sensitivity has also been trending upwards since January 2023 but might have reached a peak recently.
If I were a trader looking at PGR, in other words, I would be very interested in changes in the 10Y yields. Macroeconomics matters quite a bit for this stock right now.
This technique also helps us look at the market as a whole.
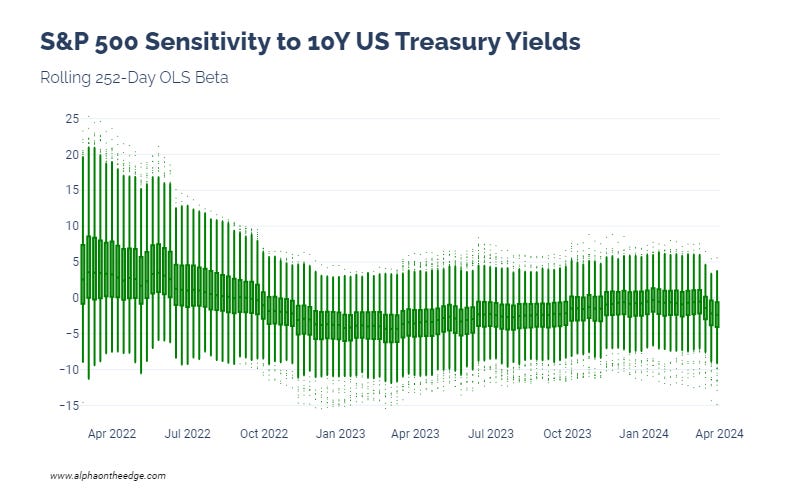
There’s a lot going on in this chart. In the middle of 2022, when the US Federal Reserve’s open market activities were front and center in the news, the stock market had a very wide, very significant spread in sensitivities to the 10Y yield. This spread narrowed throughout 2022, and the median sensitivity dipped below 0. Here in 2024, we see a somewhat consistent range of sensitivities with changing medians.
So, traders likely are not looking at 10Y yields as much as they were in 2022. But when yields become a significant market driver, this matters.
Are all macro forces as significant as 10Y yields? Let’s look at sensitivities to changes in the price of oil:

Outside of energy stocks, we see little sensitivity to oil price changes. Even though oil prices can drive inflation, oil prices themselves are not usually a significant driver. (But this can change, as we saw with our market driver framework.)
Hopefully this post helped clear up what we mean by “sensitivity” and how we use (or misuse) linear regression models. This powerful tool informs many trading algorithms and AI models, so we definitely will see the concept again.
Until next time, stay on the cutting edge, everyone.
Disclaimers
The content on this page is for educational and informational purposes only. Any views and opinions expressed belong only to the writer and do not represent views and opinions of people, institutions, or organizations that the writer may or may not be associated with.
No material in this page should be construed as buy/sell recommendations, investment advice, determinations of suitability, or solicitations. Securities investment and trading involve risks, and not all risks are disclosed or discussed here. Loss of principal is possible. You are encouraged to seek financial advice from a licensed professional prior to making transaction decisions.
Further, you should not assume that the future performance of any specific investment or investment strategy will be profitable or equal to corresponding past performance levels. Past performance does not guarantee future results.