
Rolling in the Deep: The Forces Within Market Segments
Breaking down stock market segments with market drivers

Today, we’re taking a peek at what lies underneath. We have looked at how to explain market performance at a high level, and now, we can find information about performance at a more granular level.
There’s a musical analogue to this. At the start of Wagner’s epic Ring cycle, he creates a vision of what lies beneath the surface of the Rhine river. This musical fantasy takes us to a story where beautiful Rhinemaidens live underwater, part of a world under the waves. The prelude to Das Rheingold is a sweeping, undulating, breathtaking depiction of the magic and mystery just beyond what we can see.
Surely there’s magic and mystery to market segmentation. There are no Rhinemaidens, but there are still surprises and insights - treasures in their own way. So let’s have a look.

How to Segment the Stock Market
We are returning to our familiar framework of market drivers, which helps us explain performance. (Take a look here if you need a refresher.) In our previous set of research, we saw that specific drivers came up when looking at the entire US large cap market (the S&P 500 Index). For example, sensitivity to oil prices and price acceleration were major drivers for the last four weeks.
Today, we will use two ways to create subsets of a stock market - market capitalization and sector classification. Market capitalization is a measure of the “size” of a company, calculated by multiplying the number of shares traded by the market value of those shares. Theoretically, that is the cost of a company’s traded equity. Right now, the largest two companies on the S&P 500 Index by market cap are Microsoft (MSFT - $3.1 trillion) and Apple (AAPL - $2.7 trillion).
We will use the S&P indices to separate US stocks by market cap. The headline S&P 500 Index contains the 500 largest companies by market cap in the US. The S&P MidCap 400 contains the next 400, and similarly with the S&P SmallCap 600. These three indexes are useful way to identify large, mid, and small cap stocks, respectively.
Sector classifications help divide companies by the type of markets they operate in. Microsoft and Exxon Mobil, for example, obviously sell very different products, so having a way to separate them is very useful. We will use the GICS Sector classifications, which divide stocks into 11 sectors.
Why do this? Different drivers operate on different segments of the market. Microsoft is much less associated with the price of oil than Exxon Mobil. If we can identify the drivers of specific segments, we know what is signal and what is noise.
Drivers by Market Cap
To look at driver performance for stocks of different sizes, we calculated driver performance three times, once for large caps and again for mid caps and small caps. Each set of stocks is it’s own “universe” from which we create portfolios with the top and bottom quintiles for each driver. We used the same set of 50 drivers from previous analysis, 10 drivers from 5 categories.
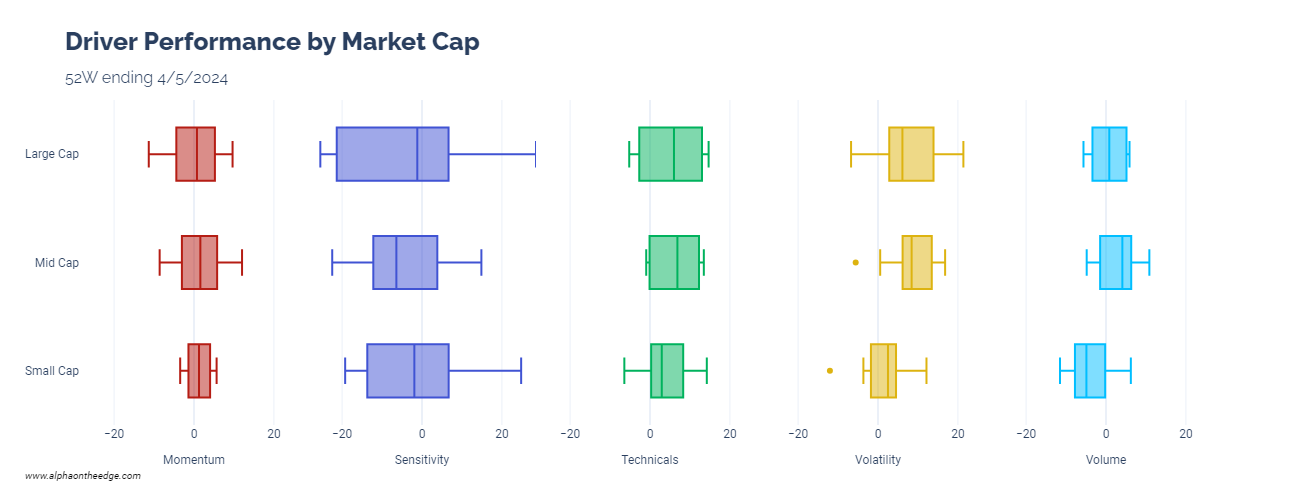
The first row in this chart shows results we’ve seen before - the same set of drivers for the S&P 500. The second and third rows are new.
Sensitivity to economic data are still significant drivers for all three market segments for similar reasons as we saw previously. The S&P 500 had a great year, and stocks with high beta to that saw the highest performance gains.
Interestingly, momentum and volatility drivers were less impactful on small caps than large caps. Small caps tended to see less herding (which happened in the large cap tech/AI companies), so the momentum effects make sense. Volatility is somewhat more complicated. Small caps tend to be more volatile than large caps, but that volatility tended to not be a significant driver for small caps.
And finally, volume activity was a more significant driver for mid caps. That might be worth looking into. Those drivers can be manipulated by large buyers/sellers, but somehow, the effects on mid caps did not translate to less liquid small caps.
Sector Drivers
In our last post, we briefly mentioned that the S&P 500’s performance in 2023 could be attributed in large part to the Information Technology and Communication Services sectors. Those are the sectors with Microsoft, Amazon, Google, Meta, and other giant tech companies. So what are the drivers of those sectors, and do they differ by market cap?
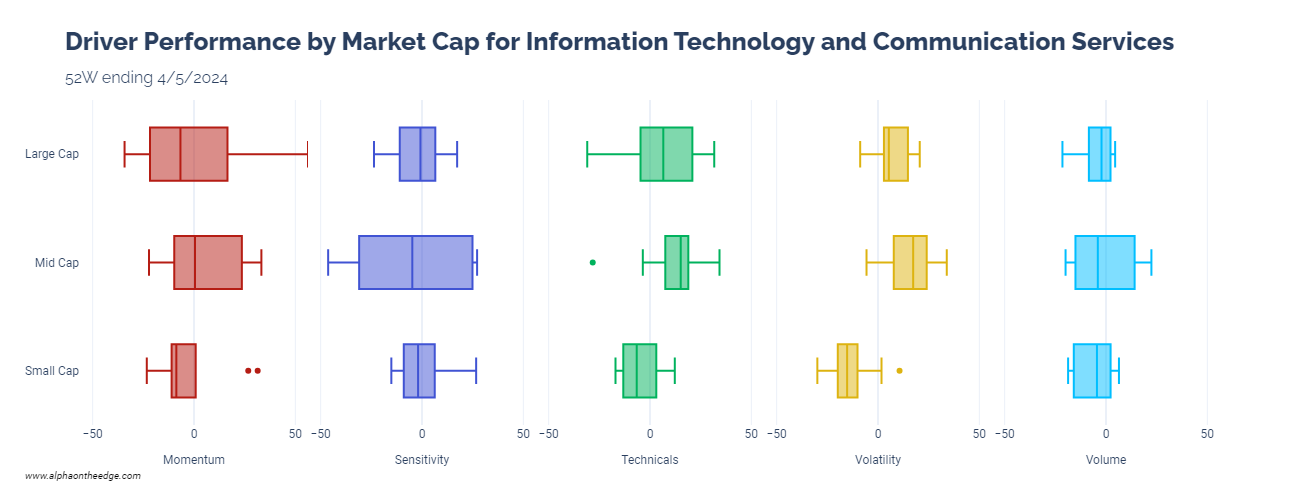
We have created three subsets again, but this time, we added the additional filter of sectors. Then, we measured driver performance again for these subsets. This explains the differences from the first set of results.
And indeed, there are quite a few differences. It is startling to see the effects of momentum on large caps in these sectors given the lackluster momentum effects on the full universe. So this means that concentrated momentum drove the full market less than it drove these two sectors.
The effects are different across market caps again, however. We see some similar patterns - less volatility for small caps, higher effects from volume activity for mid caps.
To drive home the differences among sectors, let’s look at one more set of results for market drivers. This time, we will focus purely on large caps and look at drivers for each sector individually. This means that we created 11 subsets and measured driver performance for each:
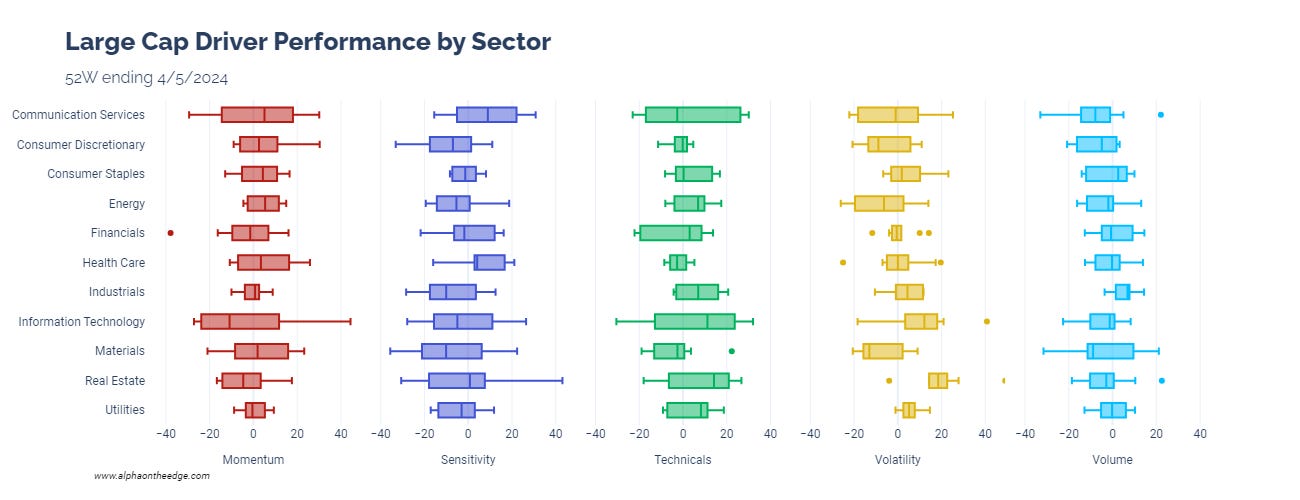
High dispersions in IT and communication services are expected, but other stories show up elsewhere - volatility in real estate and technicals in energy and industrials are stand outs. There is a lot more going on under the surface of the market here.
We didn’t find any mythical creatures or fantasy worlds here, but we did see how much segments of the market are affected by different drivers. Market segments do not react similarly to different forces, which is a key insight for traders and investors. Our driver framework continues to give us useful information for further investigation and research!
Until next time, keep on the cutting edge, everyone.
Disclaimers
The content on this page is for educational and informational purposes only. Any views and opinions expressed belong only to the writer and do not represent views and opinions of people, institutions, or organizations that the writer may or may not be associated with.
No material in this page should be construed as buy/sell recommendations, investment advice, determinations of suitability, or solicitations. Securities investment and trading involve risks, and not all risks are disclosed or discussed here. Loss of principal is possible. You are encouraged to seek financial advice from a licensed professional prior to making transaction decisions.
Further, you should not assume that the future performance of any specific investment or investment strategy will be profitable or equal to corresponding past performance levels. Past performance does not guarantee future results.